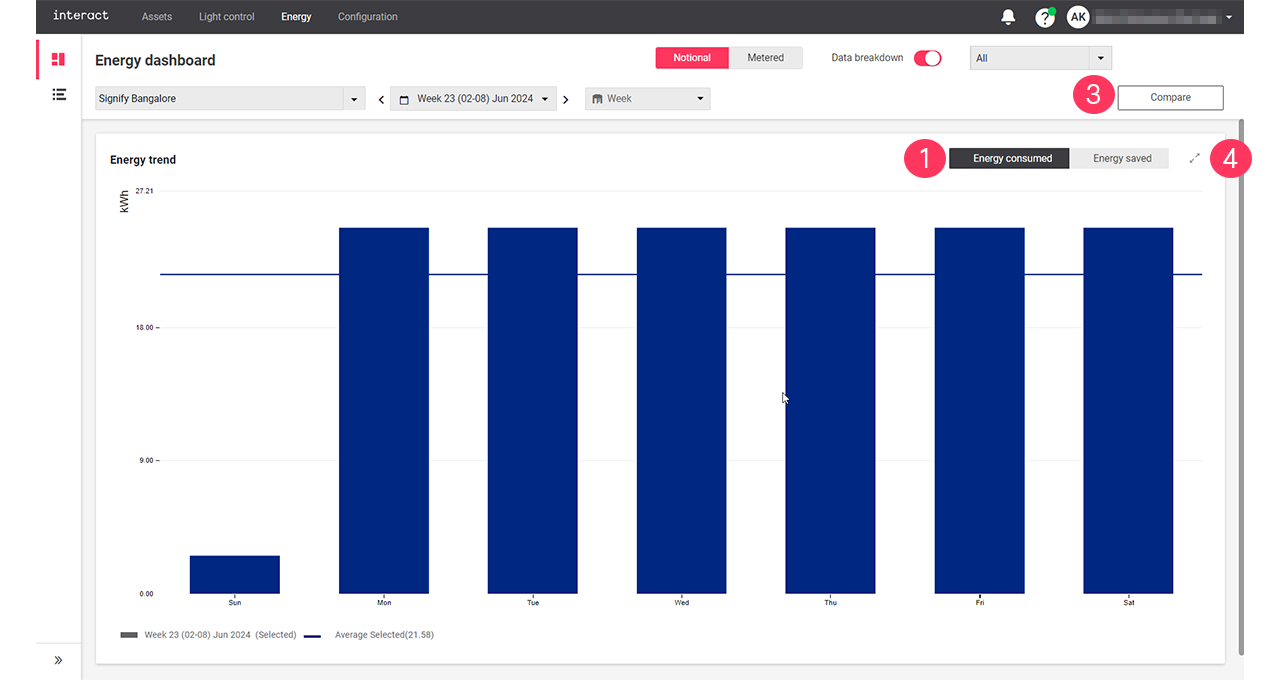
Energy trend view
The energy trend view shows a detailed diagram of either energy consumption or energy savings, that can be compared with an identical previous period.
-
For Notional only: Click Energy consumed or Energy saved to switch between views.
-
For Metered only: Use either
 or
or  to toggle between a bar chart or a line chart.
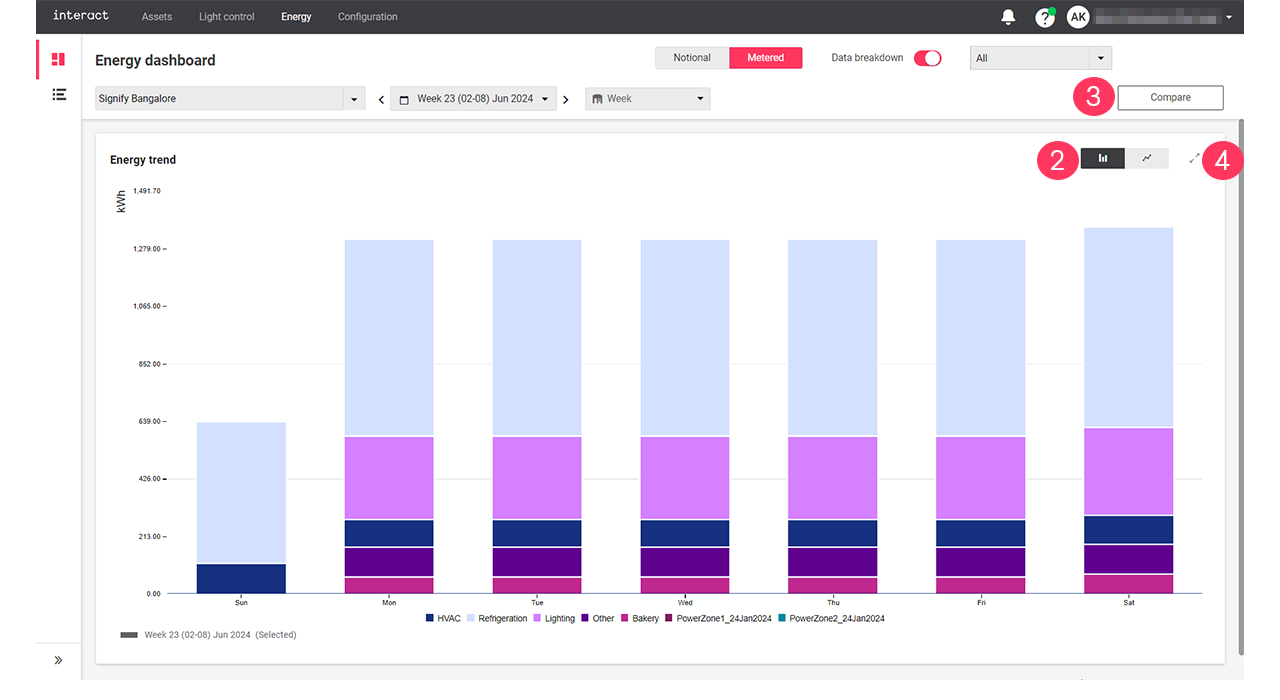
-
Click Compare to set a view to compare the energy consumption and energy saved with the previous period or another sites. For more information, see compare.
-
Click the collapse button (
 ) to return to the Energy dashboard.
| With the mouse cursor, hover over the diagrams to see the details. A dotted line shows the average over the selected period. |