Energy dashboard
The Energy dashboard shows a complete overview of energy consumption and savings of all your connected sites. You can choose between a view of all sites, but you can also view the data of a single store. If enabled, the dashboard shows the difference between notional and metered energy, otherwise metered energy will be disabled.
Select type and timeframe
-
In the menu, click Energy. The Energy dashboard (
 ) shows.
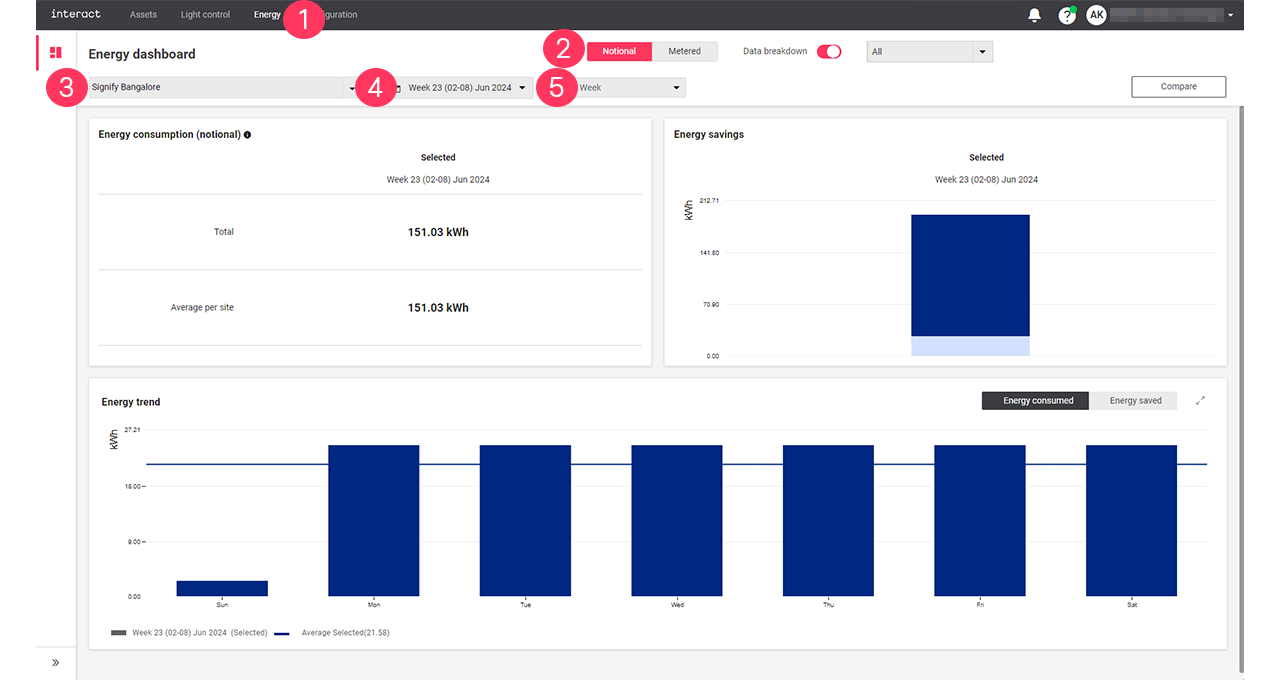
-
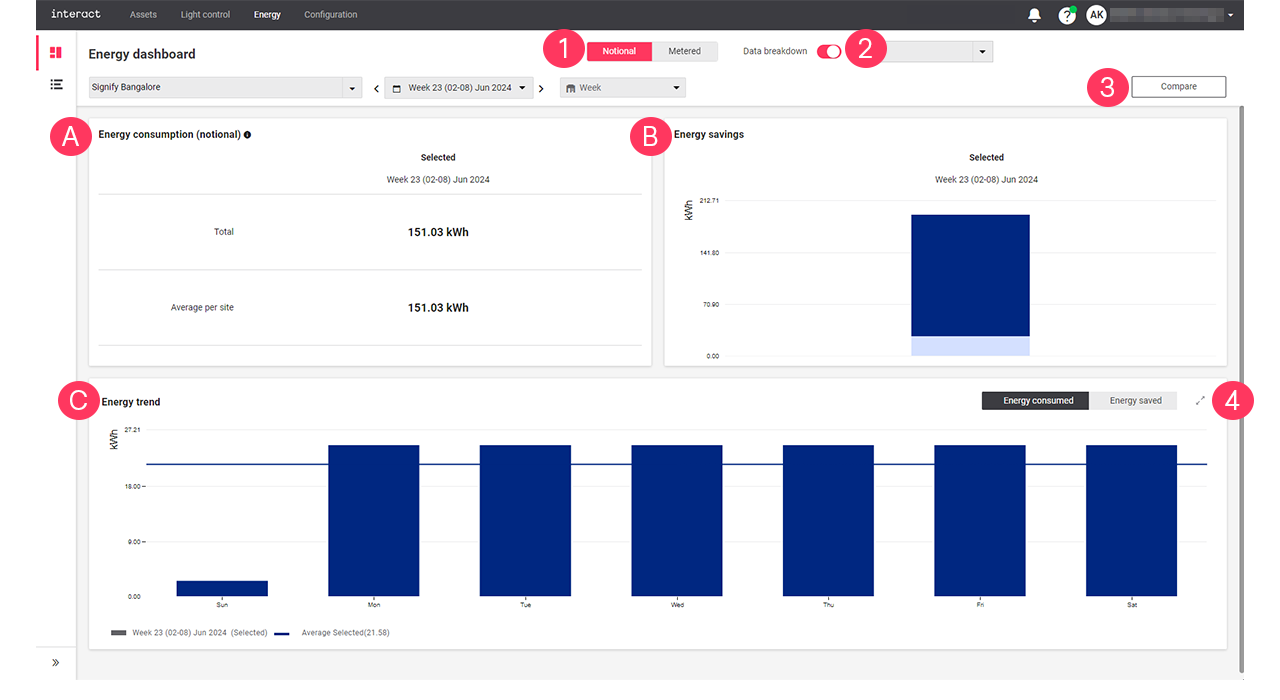
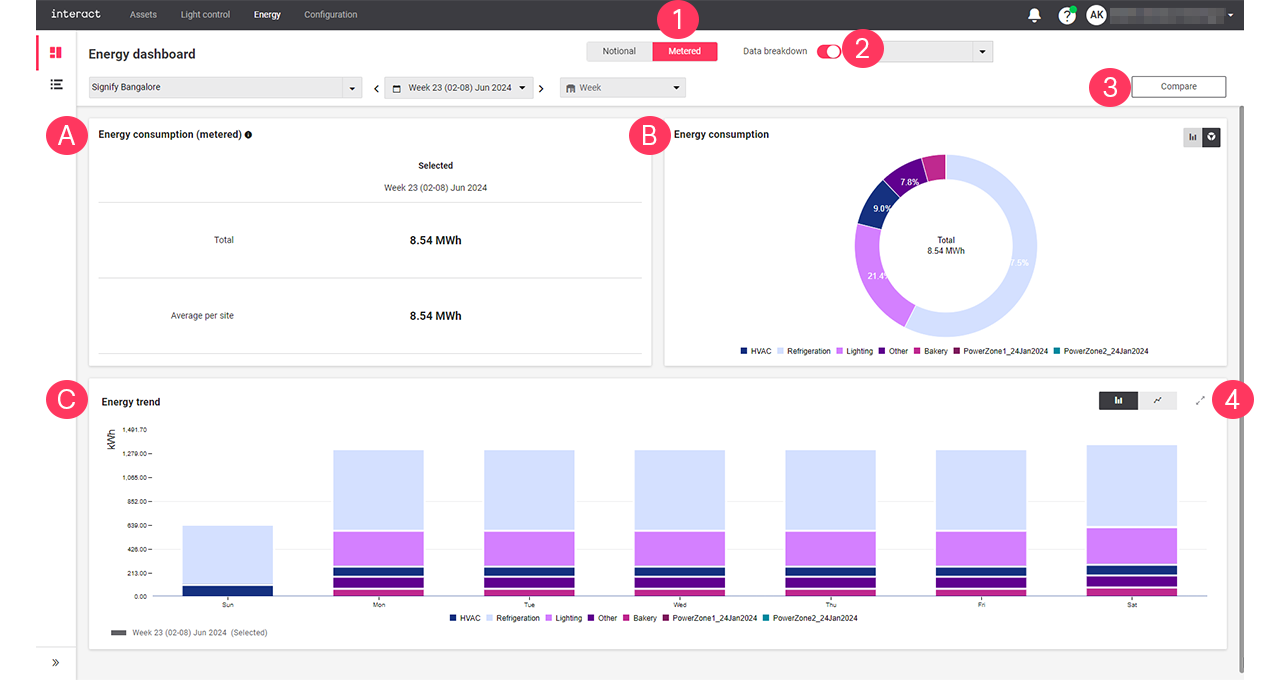
Choose between Notional and Metered to distinguish between the different types.
-
Select All sites, or a specific site to show the energy data of.
-
Select a date or a date range to select a specific period.
-
Click on the unit to refine the details of the selection.
| You can either select a day, week, or month. |
The dashboard explained: Notional
-
When you selected Notional, the dashboard shows the following information:
-
Energy consumption (notional): shows the total energy consumption and the average energy consumed per site of the selected period.
-
Energy savings: shows the amount of saved energy of the selected period.
-
Energy trend: shows a detailed overview of the energy consumption or savings of the selected period.
-
-
Turn on/turn off the Data breakdown toggle button and select a filter Select All, Dim savings, or Switch-off savings from the dropdown arrow to view the Energy savings breakdown.
-
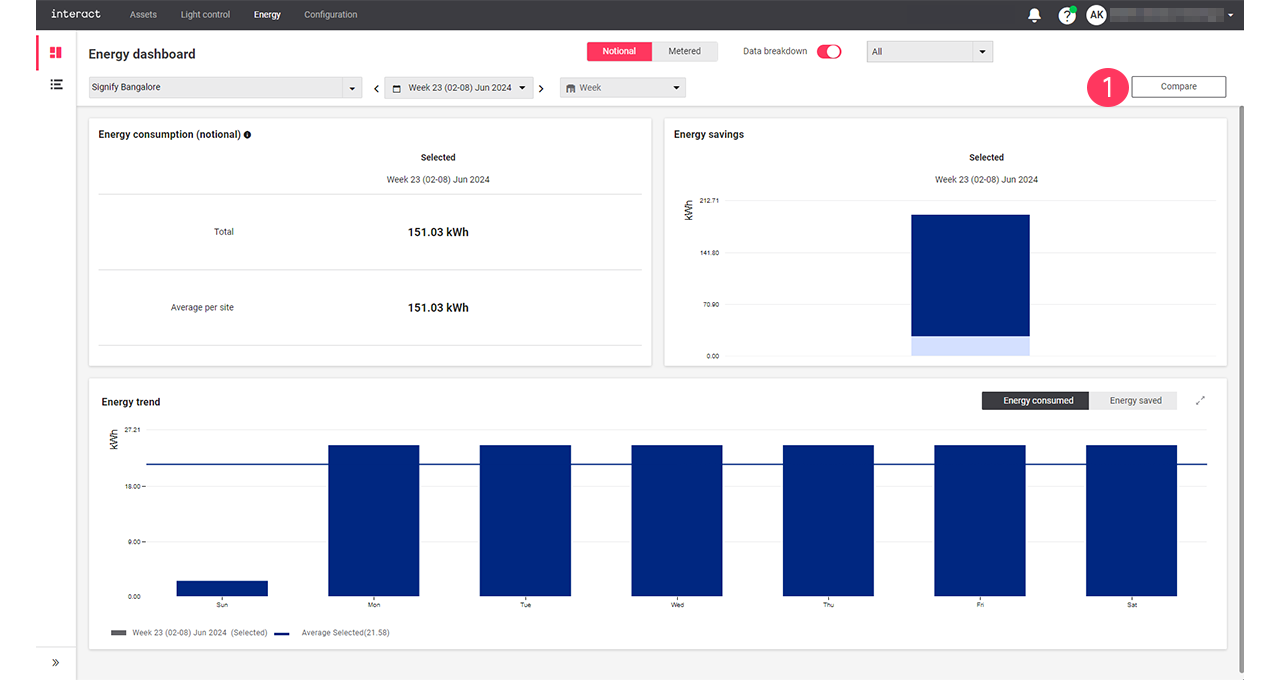
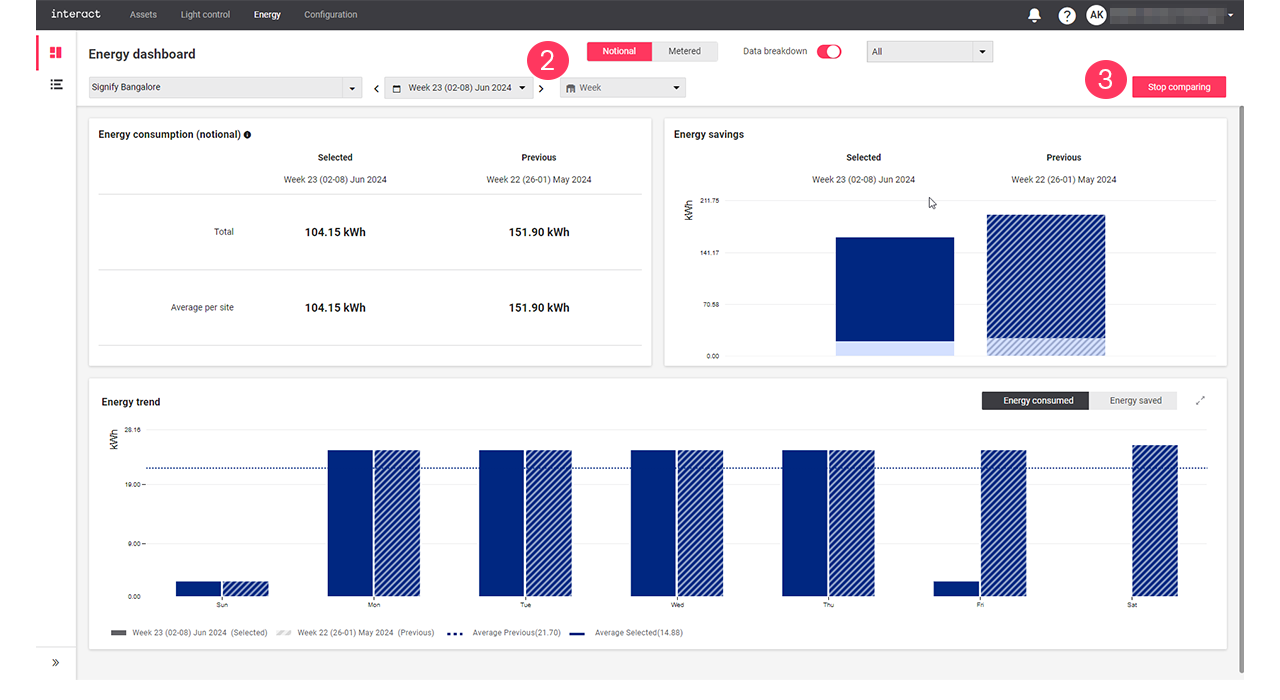
Click Compare to compare notional energy data.
-
In Energy trend, click the expand button (
 ) to open the Energy trend view.
The dashboard explained: Metered
-
When you selected Metered, the dashboard shows the following information:
-
Energy consumption (metered): shows the total energy consumption and the average energy consumed per site of the selected period.
-
Energy consumption: shows a detailed energy consumption of each metered groups for the selected period. Use either
 or
or  to toggle between a bar chart or a pie chart.
 -
Energy trend: shows a detailed overview of the energy consumption or savings of the selected period.
-
-
Turn on/turn off the Data breakdown toggle button and select the Meter groups from the dropdown arrow to view the Energy consumption breakdown.
-
Click Compare to compare metered energy data.
-
In Energy trend, click the expand button (
) to open the Energy trend view.
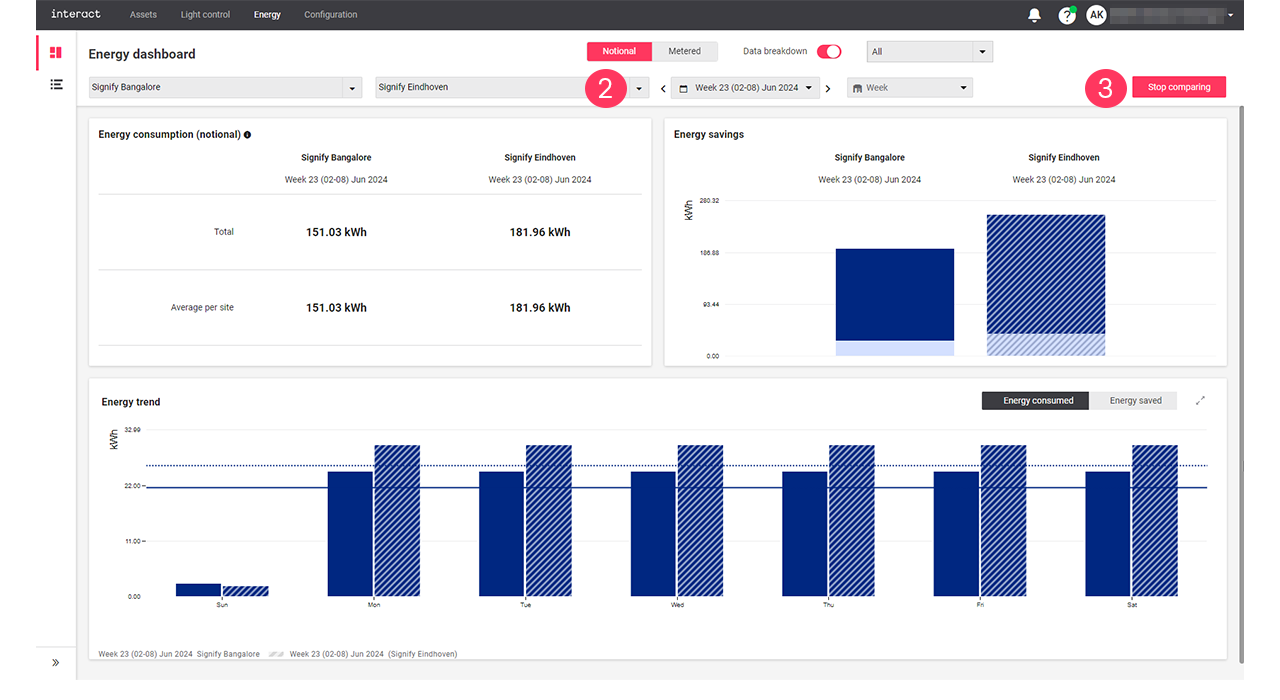
The dashboard explained: Compare
Use Compare when you want to compare the energy dashboard data of the selected period and the previous period or the current selected site with another selected site.
| The Compare button is used to compare data for both Notional and Metered. |