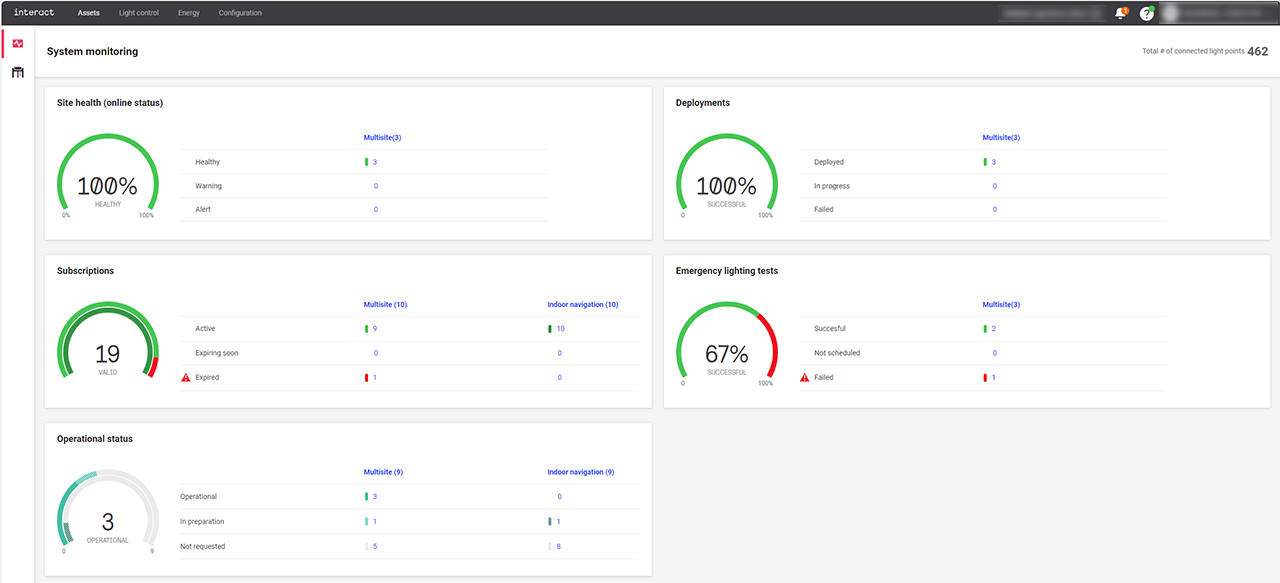
Multisite System Manager Dashboard
The Multisite System Manager Dashboard is a browser-based monitoring and control interface. It provides an intuitive overview with real-time feedback of the connected sites. The dasboard brings all data tailored to the user, depending on the roles and tasks of the person logged in.
| Access to the system is limited to authorized users only. To request user access please contact your local Signify support team. |
Prerequisites
To be able to access the Multisite System Manager dashboard, the following prerequisites must be in place:
-
Correct access rights as user
-
Valid subscription for the site(s)
-
Site(s) are operational and connected
Symbols
The dashboard user interface (UI) uses intuitive symbols and colors. The overview shows an overview of the colors and symbols used.
| Symbol | Definition | |
|---|---|---|
|
|
Critical issue |
|
|
Minor issue |
|
Status OK |
|
|
In progress |
|
|
|
Filter |
|
|
Sort |
|
Action menu |
|
|
Rotating wheel |
|
|
|
Notification |
|
|
Additional information dropdown |
|
User profile, language selection |
|
|
|
Expand/collapse the side menu |
Information
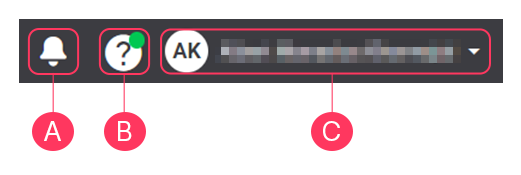
The Information section provides additional information about several items:
-
Click
 to open the Notifications, showing information about upcoming maintenance.
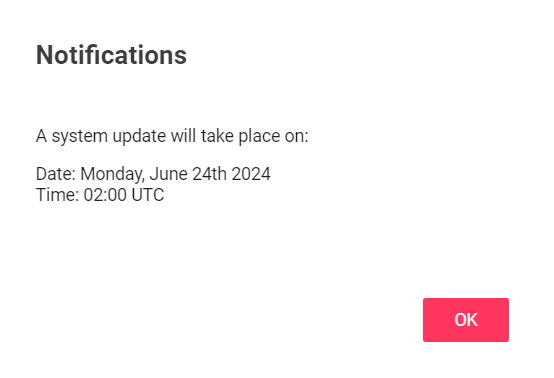
The orange dot shows the number of messages available. -
Hover over
 to see the dropdown with additional information.
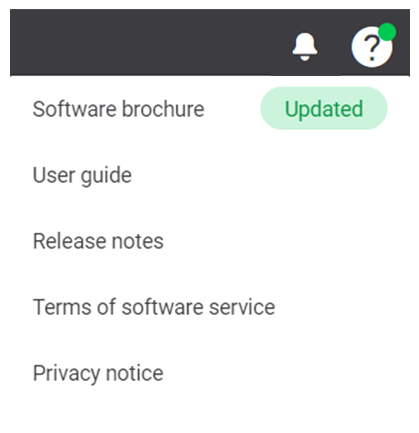
A green dot shows in the icon when items are updated. The dropdown menu also shows the updated item(s). -
At
 , you see the username of the user that is currently logged in. Hover over the icon or the name to see the dropdown.
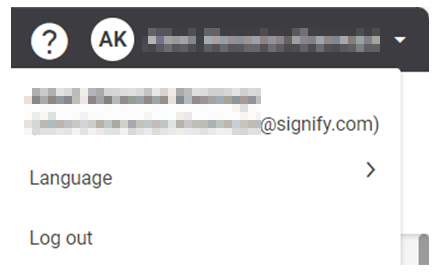
In this dropdown, it’s possible to change the interface language or logout from the dashboard. The following languages are available:
-
English
-
Dutch
-
German
-
French
-
Polish
-
Spanish
-
Russian
-
Danish
-
Italian
-
Portuguese
-
Japanese
-
Menus
The dashboard shows the required data logically grouped per selected filter on customer and site level:
-
Format
-
Site
-
Contracts
-
Licenses
The tasks are adjusted to the person logged in, preventing people making accidental changes to the settings.
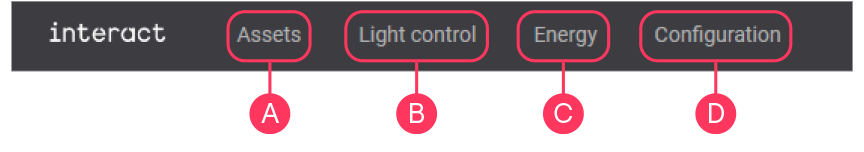
The menus of the interface give you access to the following sections:
-
Assets
The Assets tab shows a traffic light overview of the actual information for all your sites, including system health status, emergency light testing, status of licenses and deployments etcetera. It is possible to switch between a dashboard and list view.
-
Light control
In the Light control tab, you can manage the concepts, schedules, deployments, and sites. The live validation options give you the possibility to view your settings onsite.
-
Energy
The glanceable dashboard of the Energy tab shows all kind of energy data, like historical energy consumption trends, site comparison and energy savings breakdowns.
-
Configuration
The Configuration tab shows per format the overview of the areas and the applicable scenes.