Energy
The Energy dashboard provides insights in the energy consumption and savings of all your sites. This dashboard shows you the most relevant parameters, including:
-
Energy consumption
-
Energy savings
-
Energy trend compared with the previous period or selected site
On the Energy dashboard, it’s easy to switch between views for notional or metered energy. You can choose a site and time period to view data, and compare it with another site or time period. The energy trend graph shows more detailed data. It’s also possible to show a breakdown of the energy savings or the energy consumption for notional or metered energy. The Site list view shows a ranking of all the sites in your portfolio.
About notional and metered energy
The Energy dashboard can show both notional and metered energy. Because both methods are quite different, it’s very well possible to use them alongside each other and even complementary to each other.
Notional energy gives a theoretical, indicative value calculated from the given installed power of all light points controlled by the system and their behavior (switching, dimming). It’s possible to divide between the energy consumption per logical or physical channel, showing high granularity and keeping track of notional burning hours of the light points. As notional energy is a calculated value, it even allows to predict energy consumption of scenes and schedules that are intended for use.
Metered energy gives an absolute number based on physically metering the energy consumption per electrical circuit (power group). As you can add electricity meters in virtually all circuits, you can also monitor the energy consumption of circuits beyond lighting, for example refrigerators or HVAC.
The numbers in both notional and metered energy are derived in completely different ways, which makes it highly unlikely that you can compare both numbers.
Energy dashboard
The Energy dashboard shows a complete overview of energy consumption and savings of all your connected sites. You can choose between a view of all sites, but you can also view the data of a single store. If enabled, the dashboard shows the difference between notional and metered energy, otherwise metered energy will be disabled.
Select type and timeframe
-
In the menu, click Energy. The Energy dashboard (
 ) shows.
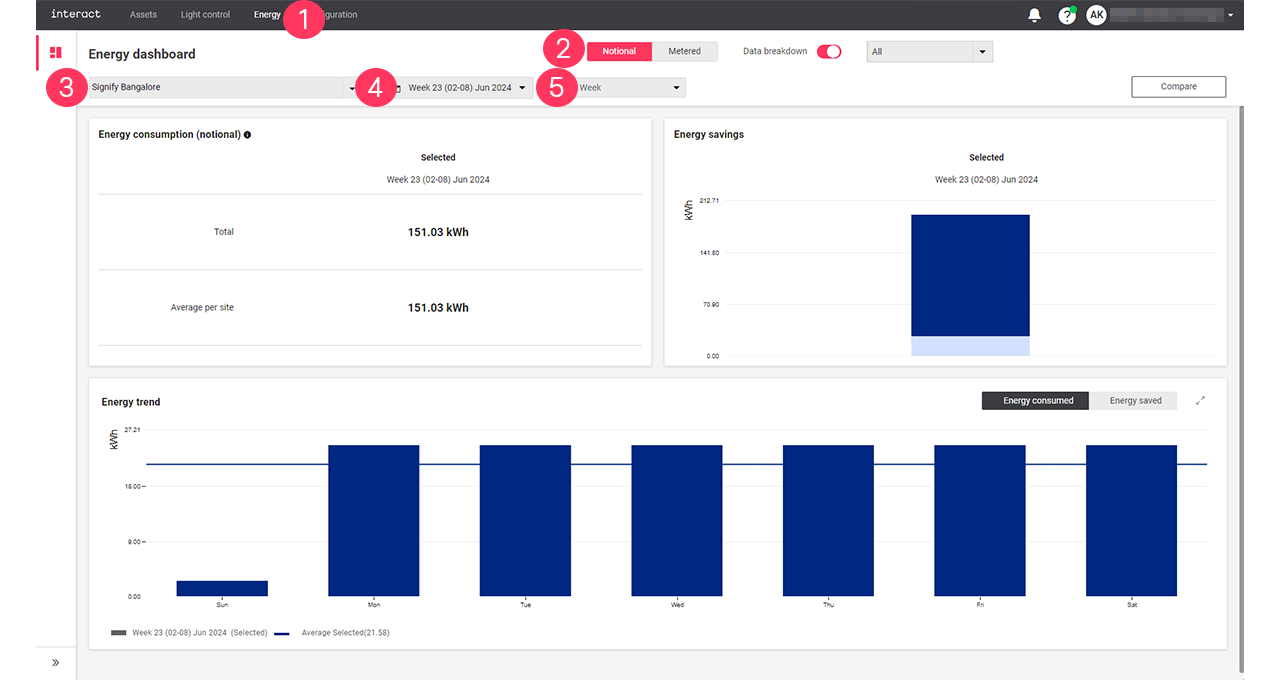
-
Choose between Notional and Metered to distinguish between the different types.
-
Select All sites, or a specific site to show the energy data of.
-
Select a date or a date range to select a specific period.
-
Click on the unit to refine the details of the selection.
| You can either select a day, week, or month. |
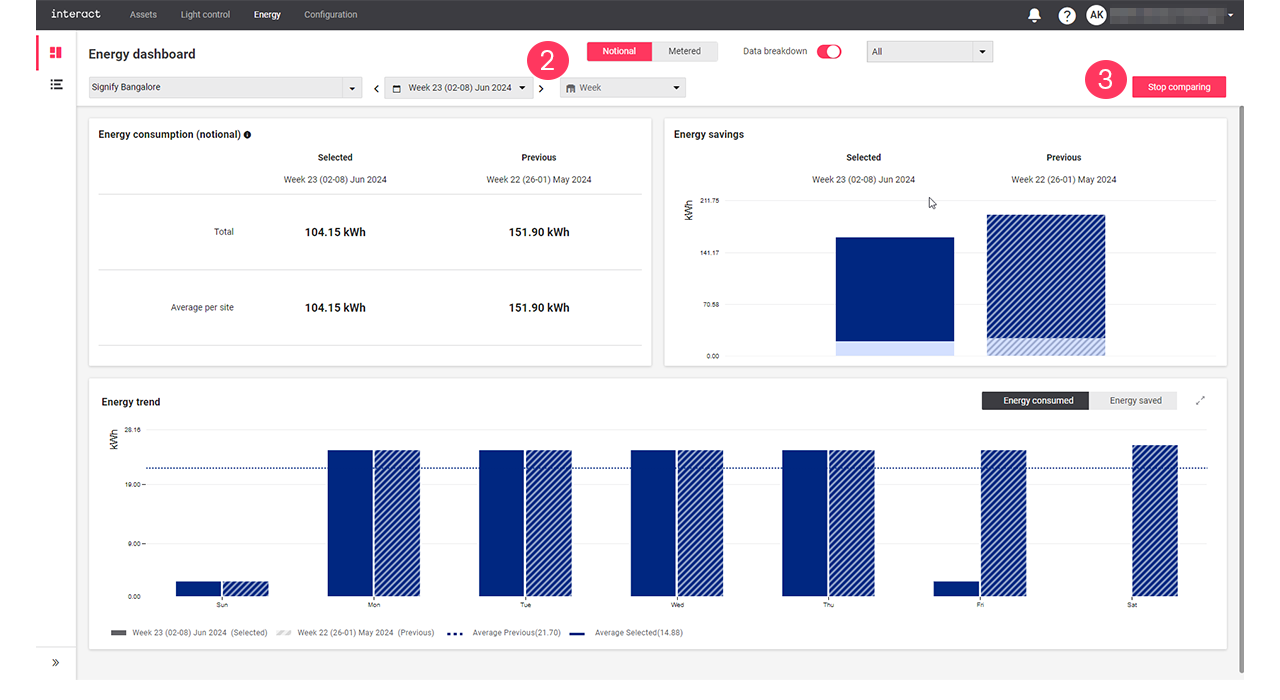
The dashboard explained: Notional
-
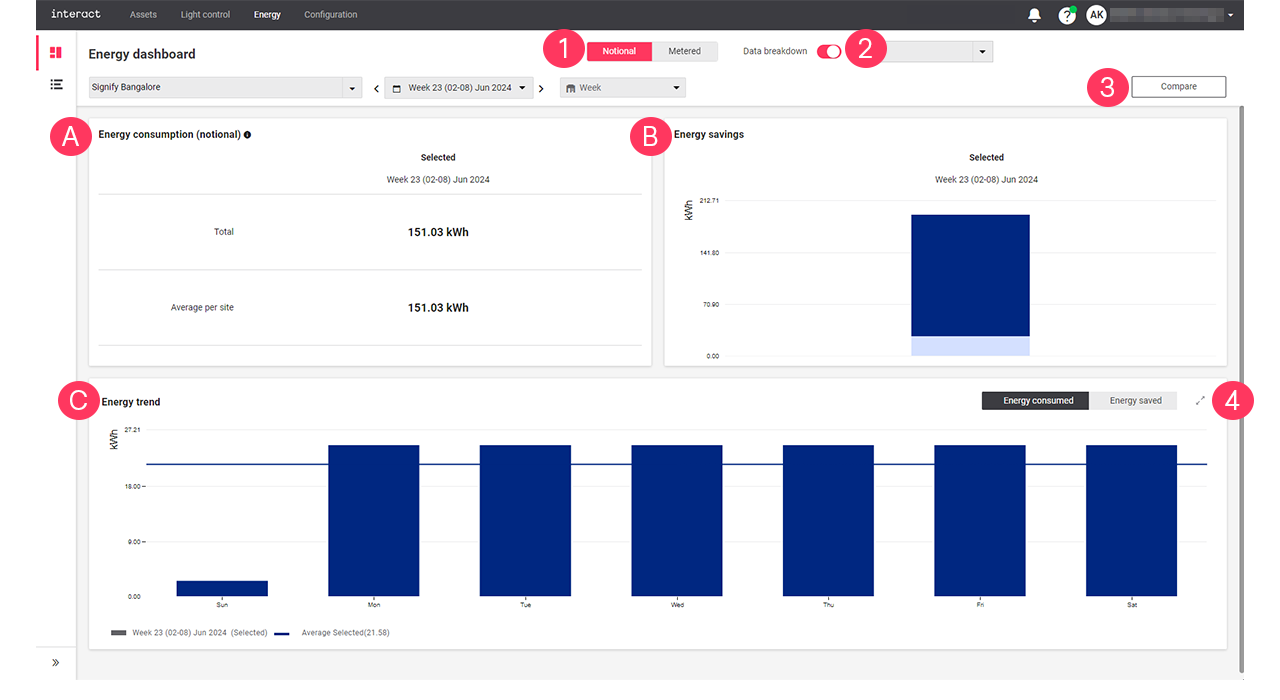
When you selected Notional, the dashboard shows the following information:
-
Energy consumption (notional): shows the total energy consumption and the average energy consumed per site of the selected period.
-
Energy savings: shows the amount of saved energy of the selected period.
-
Energy trend: shows a detailed overview of the energy consumption or savings of the selected period.
-
-
Turn on/turn off the Data breakdown toggle button and select a filter Select All, Dim savings, or Switch-off savings from the dropdown arrow to view the Energy savings breakdown.
-
Click Compare to compare notional energy data.
-
In Energy trend, click the expand button (
 ) to open the Energy trend view.
The dashboard explained: Metered
-
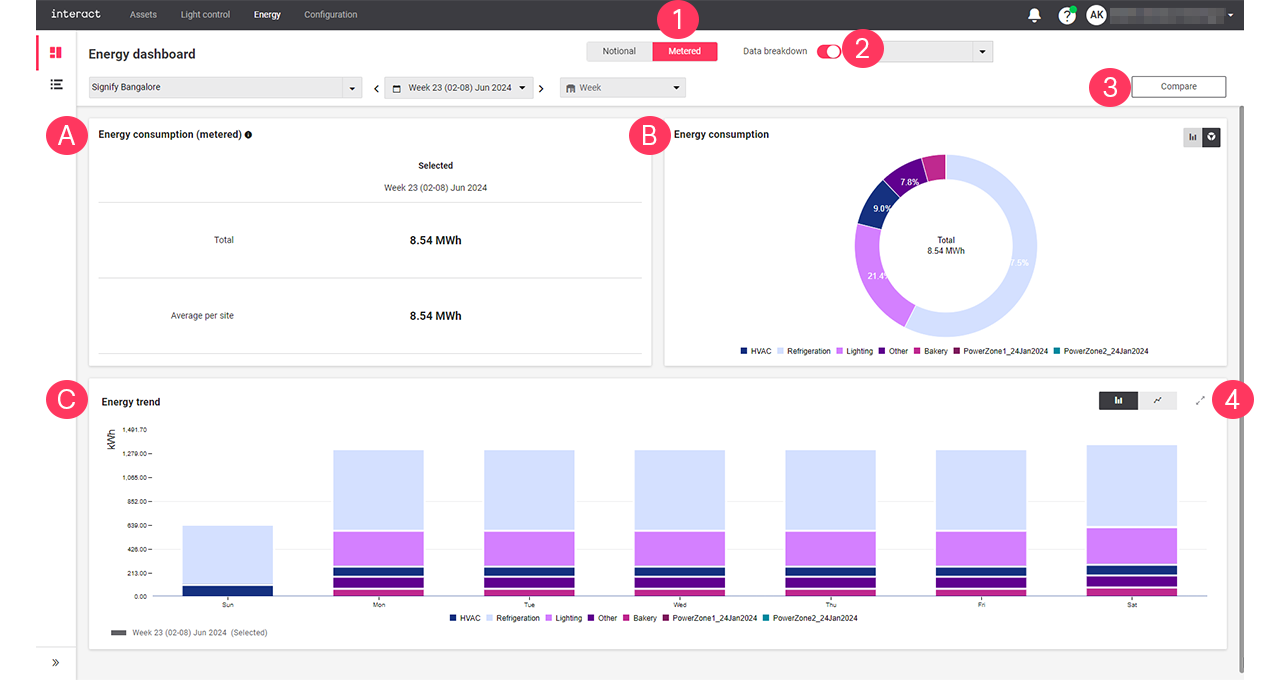
When you selected Metered, the dashboard shows the following information:
-
Energy consumption (metered): shows the total energy consumption and the average energy consumed per site of the selected period.
-
Energy consumption: shows a detailed energy consumption of each metered groups for the selected period. Use either
 or
or  to toggle between a bar chart or a pie chart.
 -
Energy trend: shows a detailed overview of the energy consumption or savings of the selected period.
-
-
Turn on/turn off the Data breakdown toggle button and select the Meter groups from the dropdown arrow to view the Energy consumption breakdown.
-
Click Compare to compare metered energy data.
-
In Energy trend, click the expand button (
) to open the Energy trend view.
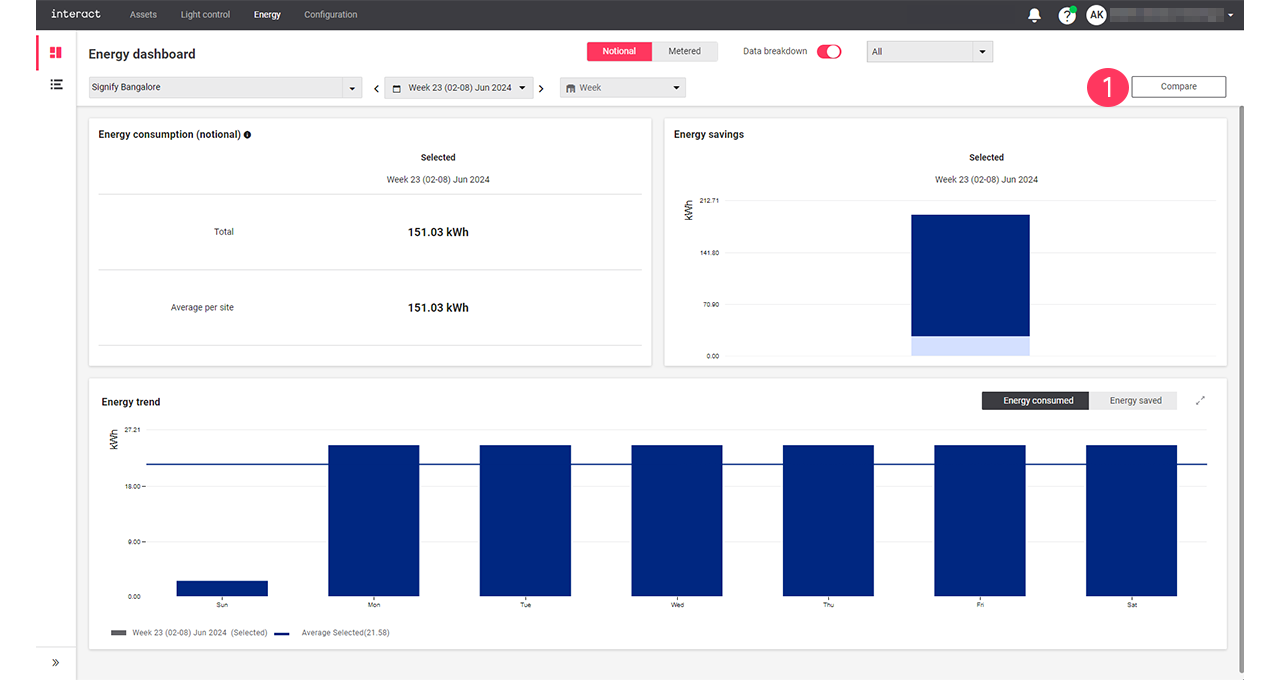
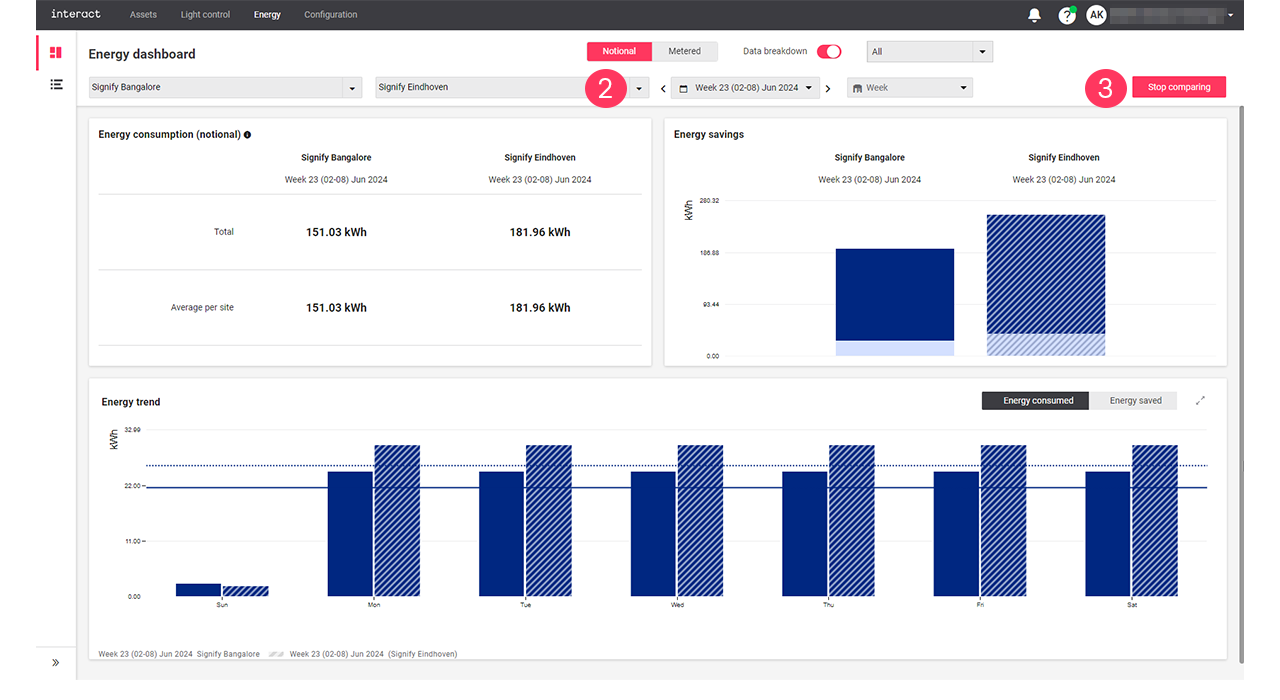
The dashboard explained: Compare
Use Compare when you want to compare the energy dashboard data of the selected period and the previous period or the current selected site with another selected site.
| The Compare button is used to compare data for both Notional and Metered. |
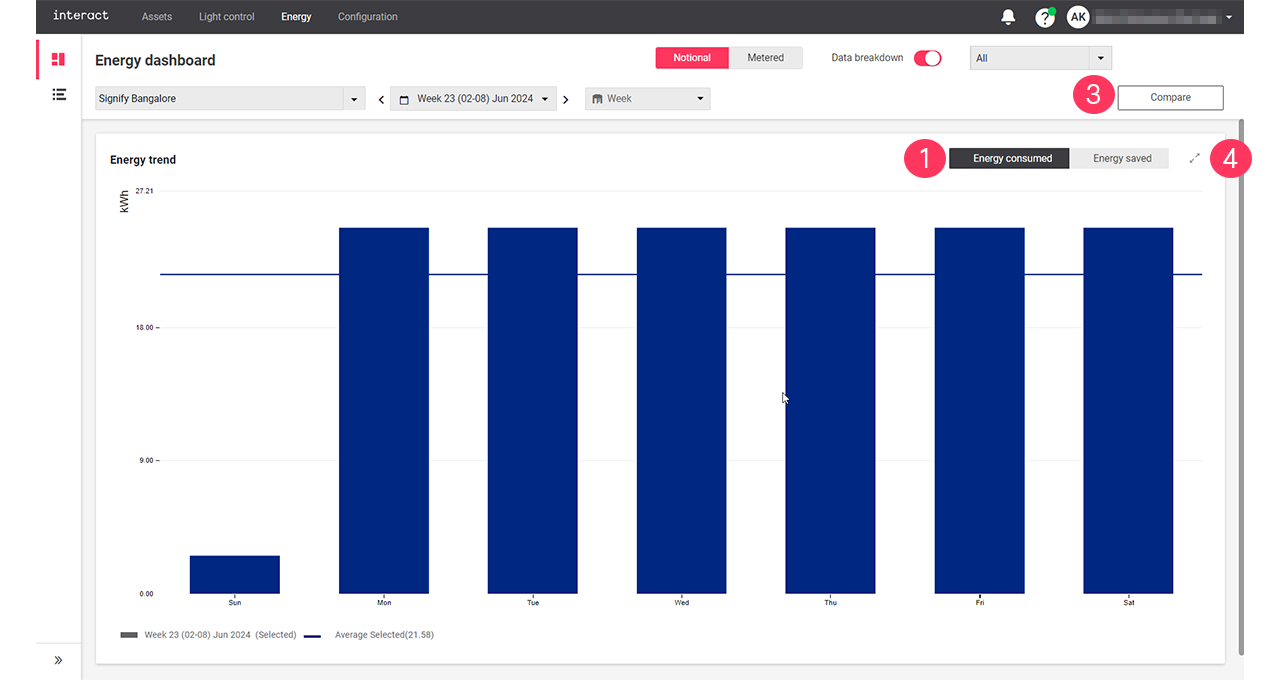
Energy trend view
The energy trend view shows a detailed diagram of either energy consumption or energy savings, that can be compared with an identical previous period.
-
For Notional only: Click Energy consumed or Energy saved to switch between views.
-
For Metered only: Use either
 or
or  to toggle between a bar chart or a line chart.
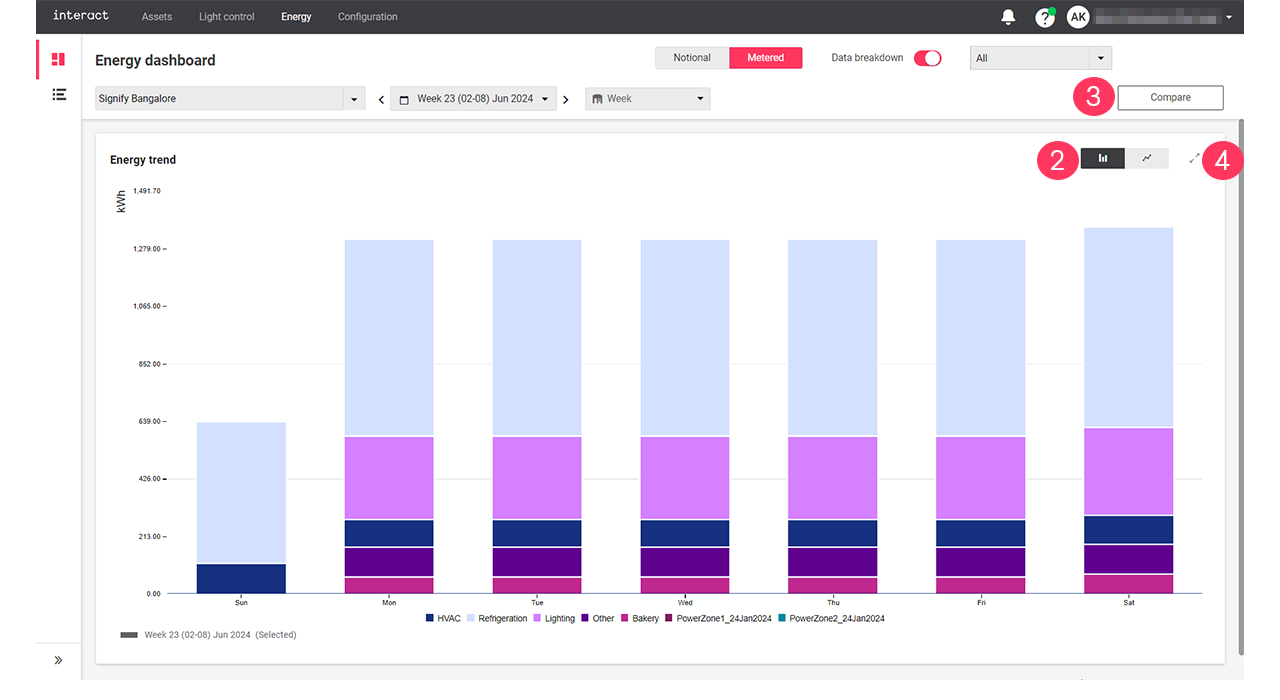
-
Click Compare to set a view to compare the energy consumption and energy saved with the previous period or another sites. For more information, see compare.
-
Click the collapse button (
 ) to return to the Energy dashboard.
| With the mouse cursor, hover over the diagrams to see the details. A dotted line shows the average over the selected period. |
Site list view
The Site list view shows a table summary of energy consumption and savings for all sites. It also includes the site names, their formats, and the number of light points each site has. The Consumed energy and Saved energy are two distinct columns, each consisting of four sub-columns: MWh, kWh/Light points, Wh/m2, and %.
| The unit of measurement can be Wh (watt-hours), kWh (kilowatt-hours), MWh (megawatt-hours), or TWh (terawatt-hours). These units automatically change depending on the period (Days, Weeks, Months, and Year). |
-
Use the sorting (
 ) to define the order from lowest to highest, or vice versa.
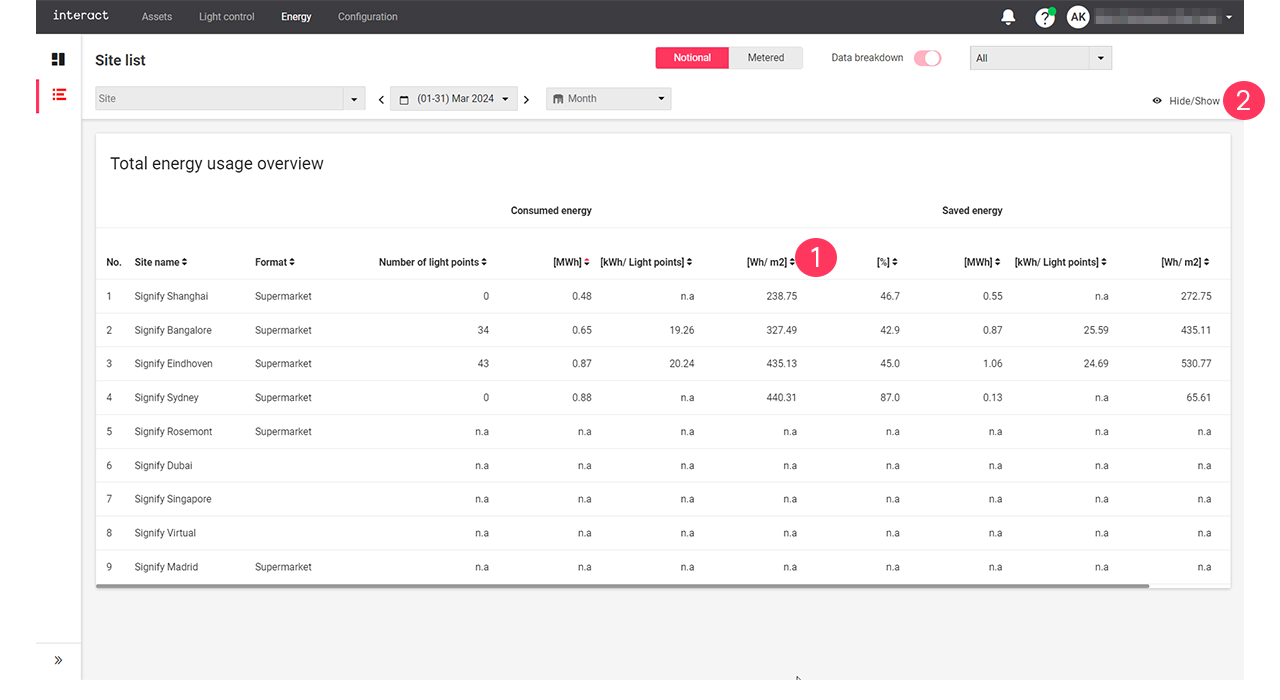
-
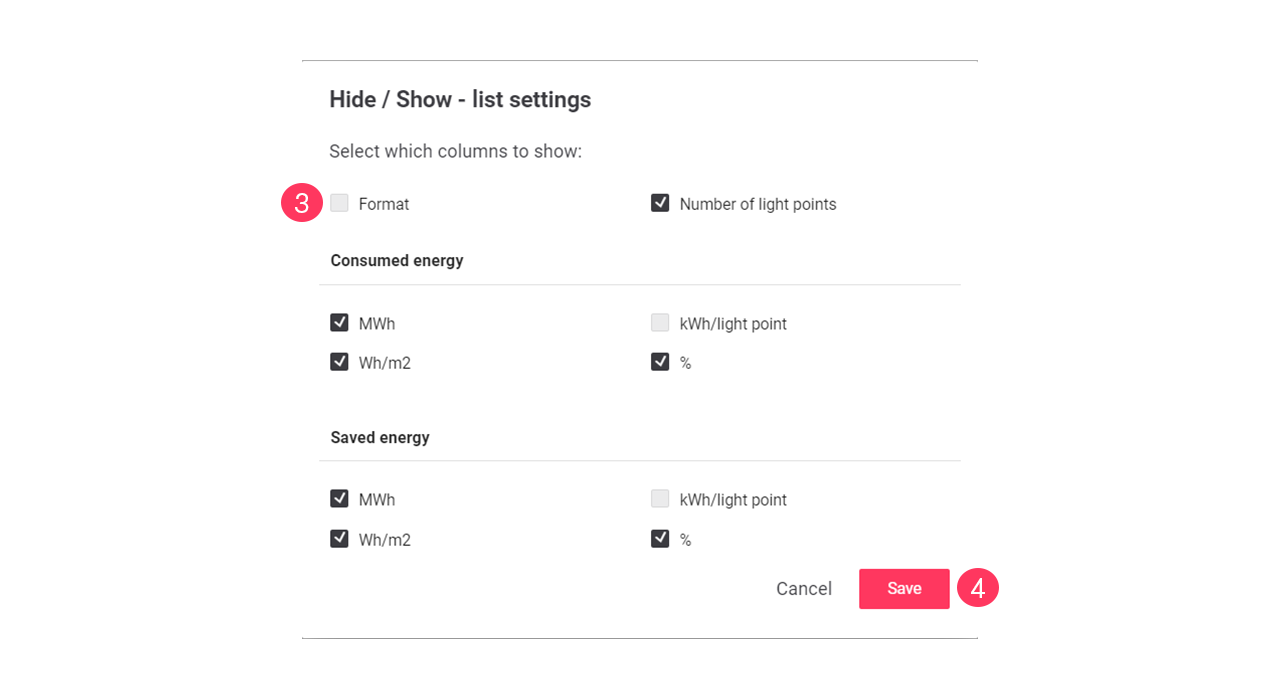
Click the Hide/unhide button in the Site list view.
-
Clear/select the checkboxes you want to hide/show in the table respectively.
-
Click Save.