Assets
The Assets menu gives an overview of all your sites in a single dashboard. This dashboard shows you the most relevant information about your sites, including:
-
System health status
-
Status of deployments
-
Status of subscriptions
-
Status of connected emergency light testing
-
Overview of sites that are operational or in deployment
On the dashboard, it’s easy to toggle between list view and detailed site view, and search and filter functions help finding the information for the site(s) you are looking for.
System monitoring and site list
System monitoring provides you an overview of the status of all your connected sites, either Multisite or Indoor Navigation. This section explains only the Multisite functions.
-
In the menu, click Assets. The Dashboard (
 ) shows consisting of the following performance indicators:
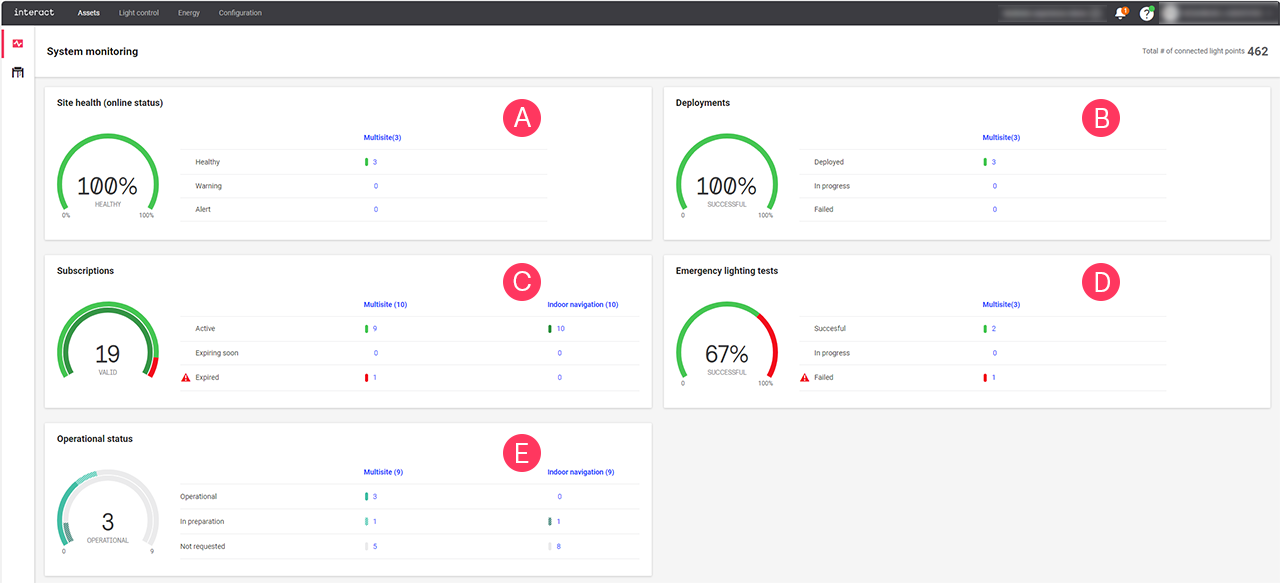
-
Site health: online status of each site:
-
Healthy: no issues
-
Warning: site experiences minor issues, requires attention
-
Alert: site experiences critical issues, requires immediate attention
-
-
Deployments: deployment status of each site:
-
Deployed: OK
-
In progress: a deployment is running
-
Failed: the deployment was not successful, requires attention
-
-
Subscriptions: overview of the subscriptions of each site:
-
Active: OK
-
Expiring soon: licenses are approaching their date of expiry, extend the licenses to avoid losing access in the data
-
Expired: there are expired licenses, renew to get access to the data
-
-
Emergency lighting tests: provides the status of last emergency lighting test of each site:
-
Successful: functional and duration tests of all emergency lights are successful
-
In progress: tests are not yet scheduled or executed or tests are in progress
-
Failed: functional and/or duration tests of emergency lights are failed
-
-
Operational status
-
Operational: site operational and handed over to the customer
-
In preparation: open workorders in place for design, installation, and commissioning
-
Not requested: site created, no open workorders
-
-
-
Click the Site list (
 ) or Multisite indicating the column in any of the performance indicators to access the detailed list of sites.
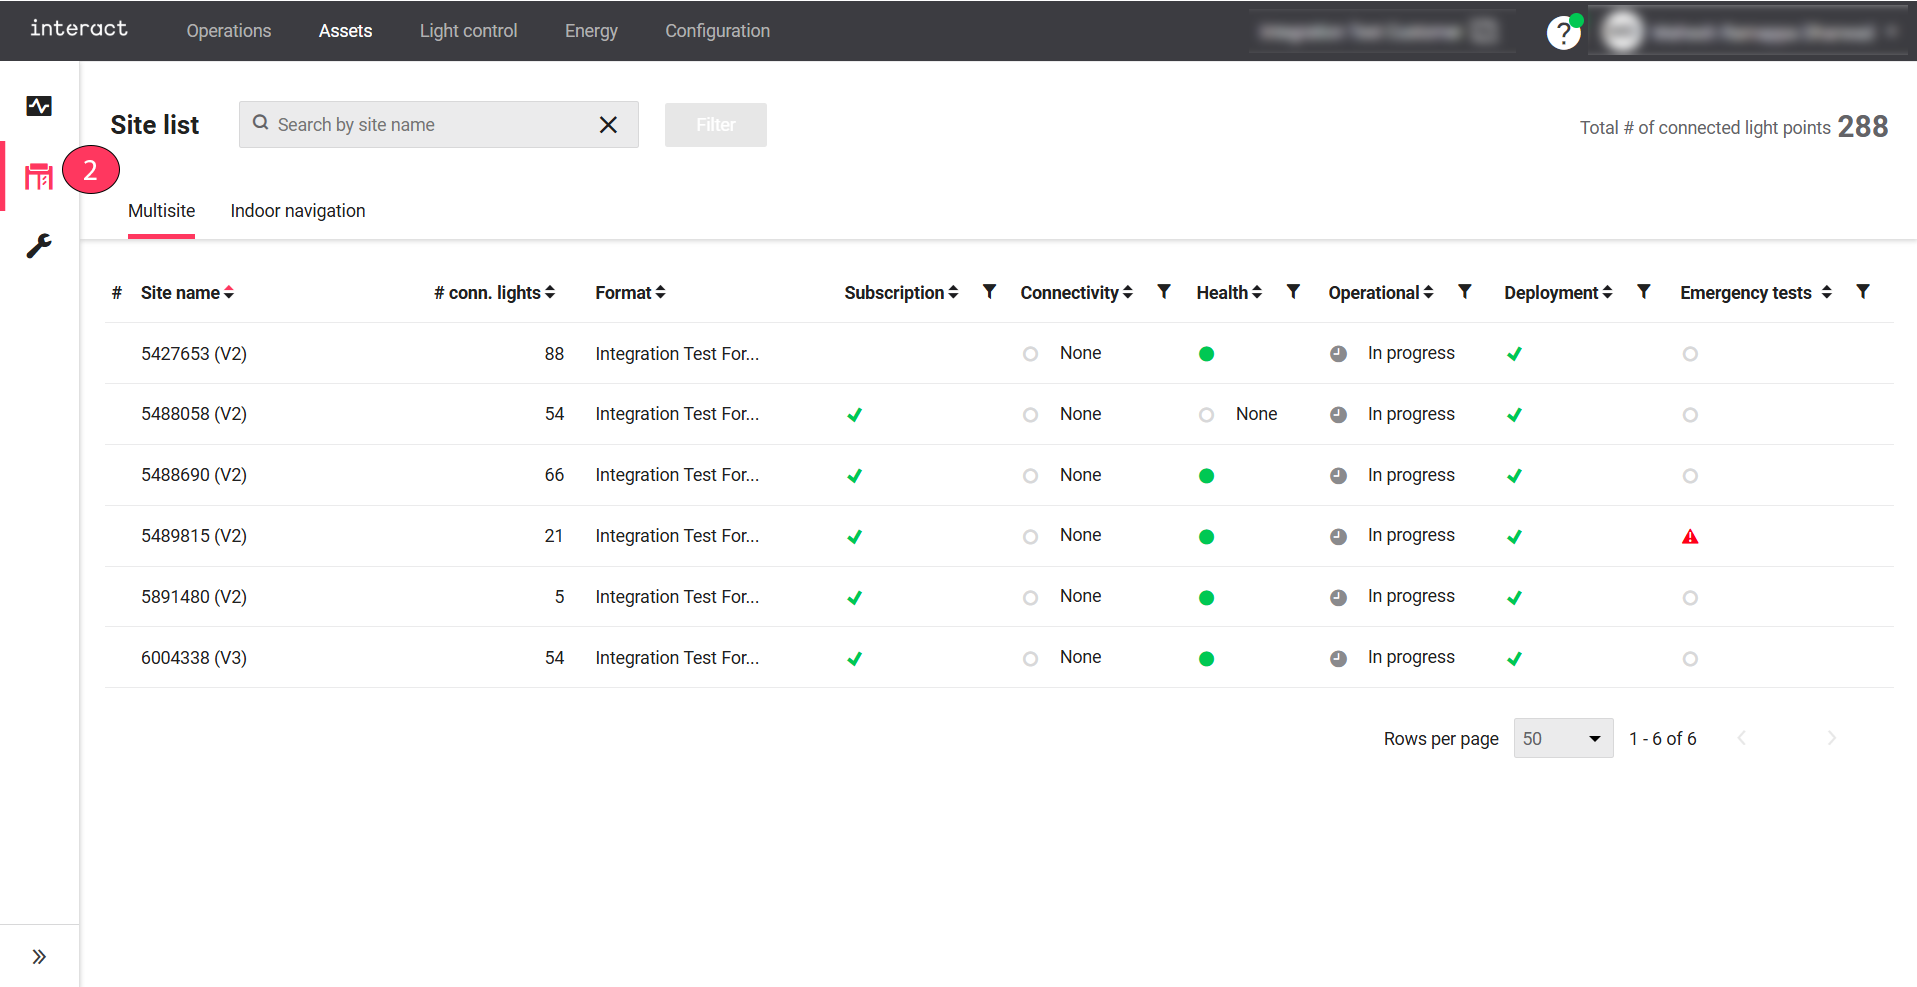
-
Use the sorting (
 ) and filter (
 ) tools to define and limit the sites shown in the Site list.
 -
Click Dashboard (
 ) to revert to the initial dashboard screen.
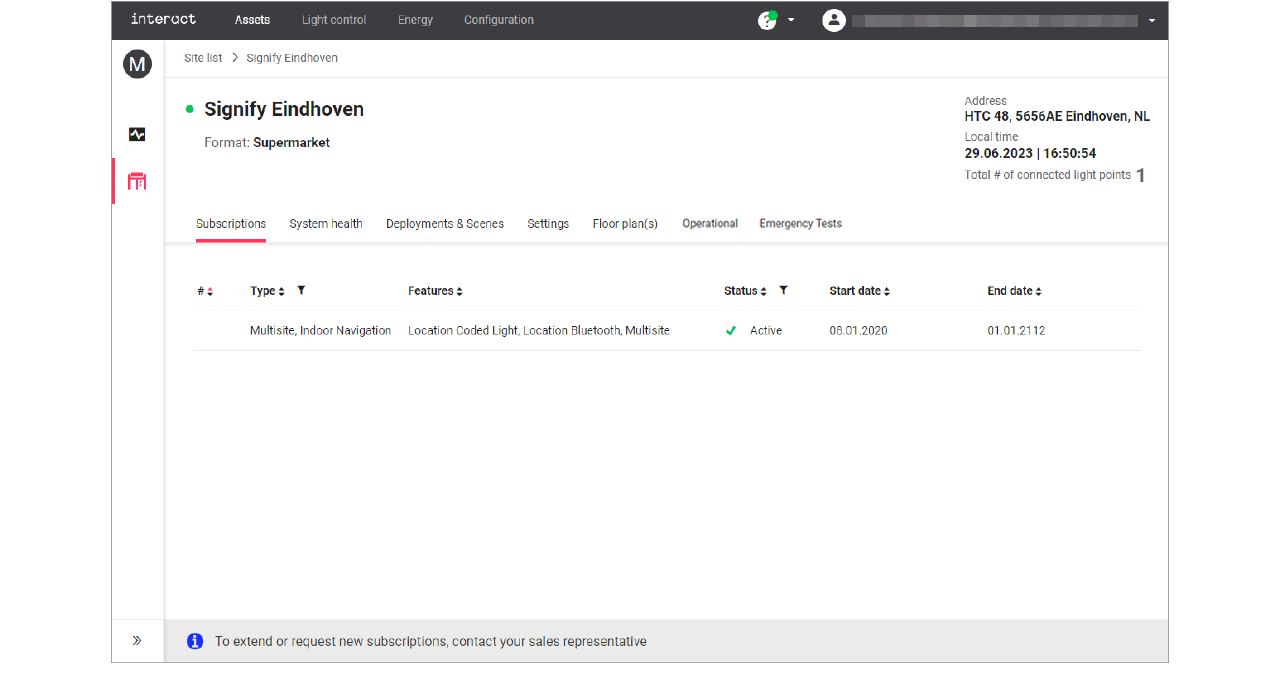
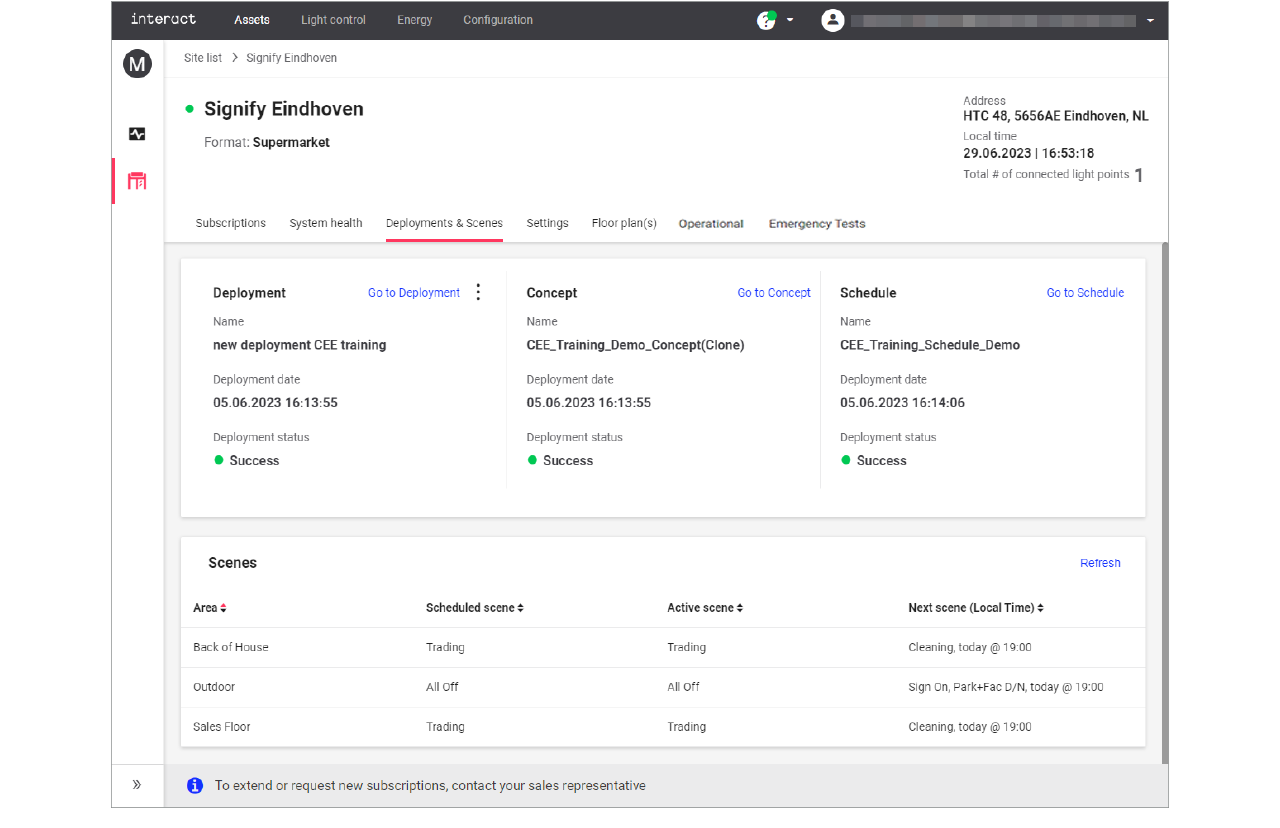
Detailed site view
In the Site list, click on the row of a specific site to access the details of that site.
-
Subscriptions: shows the licenses linked to the site and their status. To extend, or request new subscriptions, contact your sales representative.
-
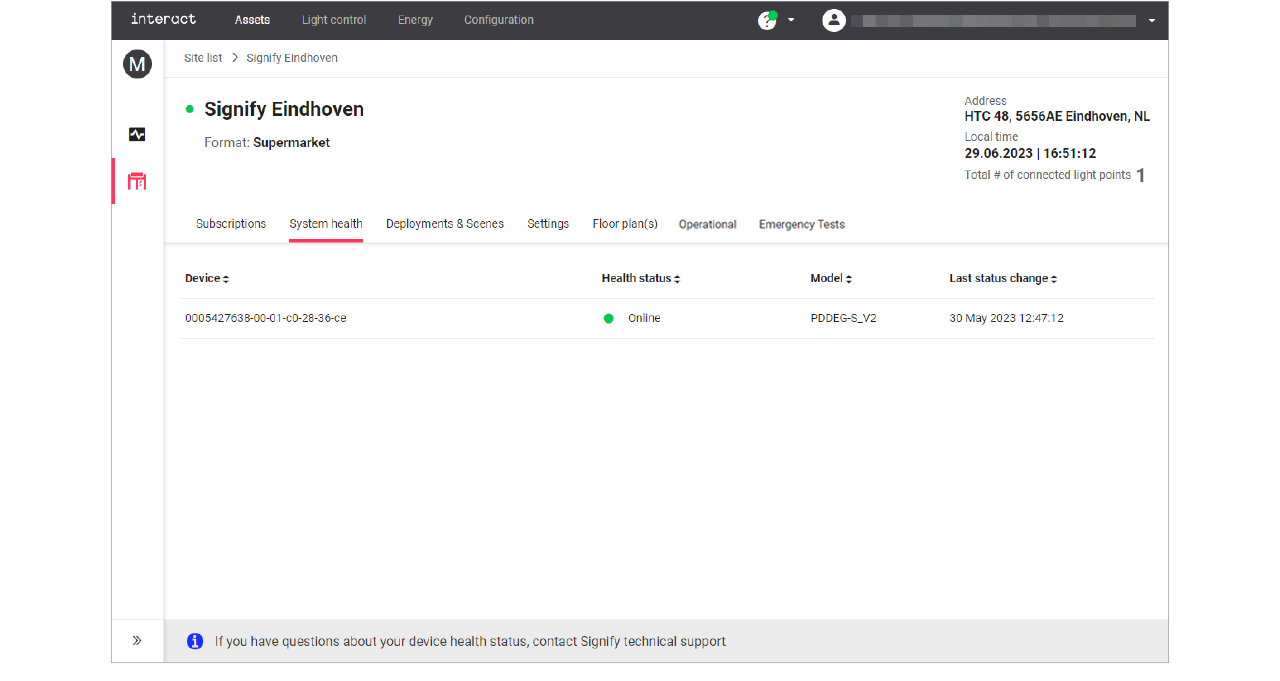
System health: shows if the gateway of the site is online or any other status. In case you have questions about the health status, contact Signify technical support.
-
Deployments & Scenes: shows the current deployment, concept, and schedule as well as details of the currently running scene; see sections Overview and Scenes for more information.
-
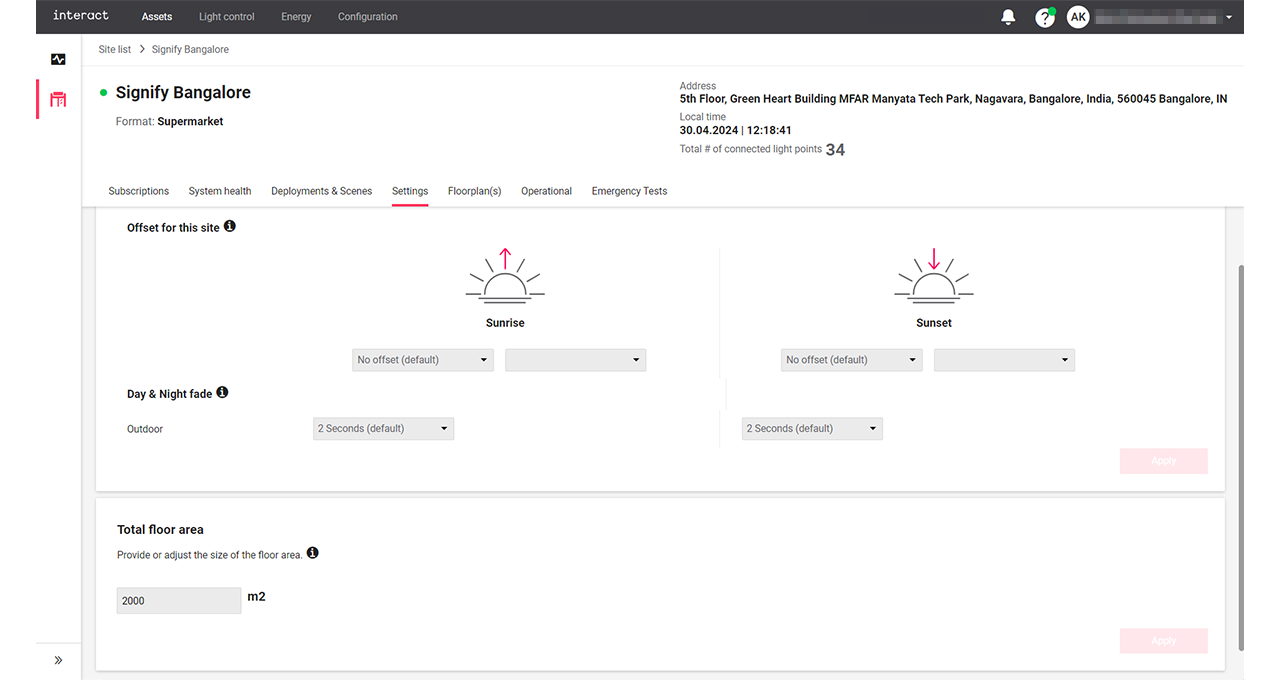
Settings: used to set generic settings that are applicable for the selected site, see section Settings for more information.
-
Emergency Tests: shows the overview information of each test configuration for both functional and duration tests for the selected site. Click Download report button to download the detailed test report comprising the results of the latest functional and duration tests. The Actions menu (
 ) provides an option to view more details of the test results. For more details, refer to the section Emergency test.
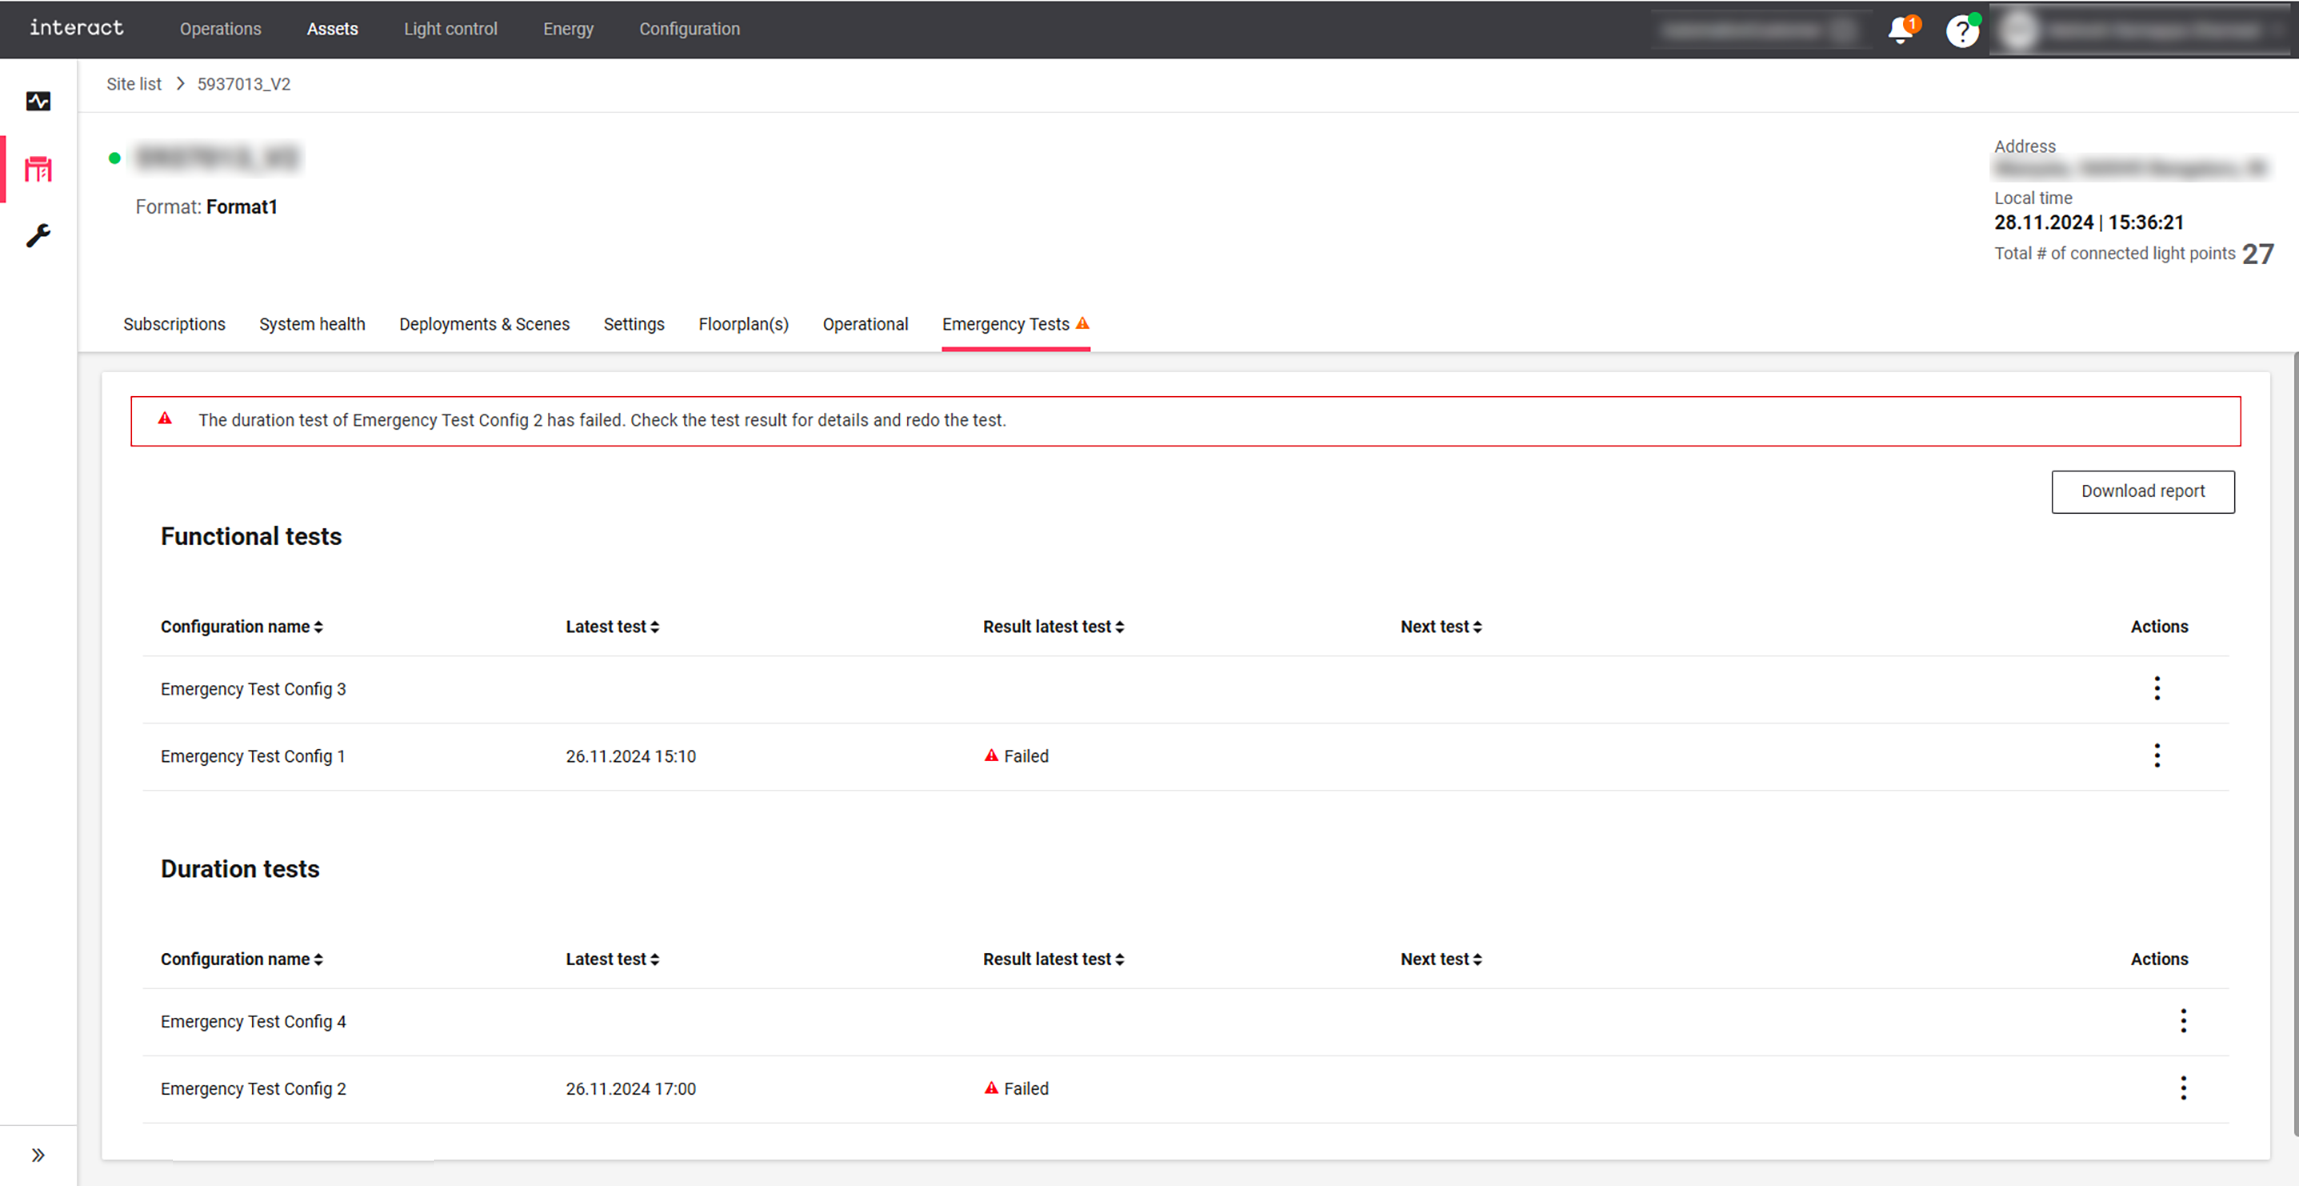
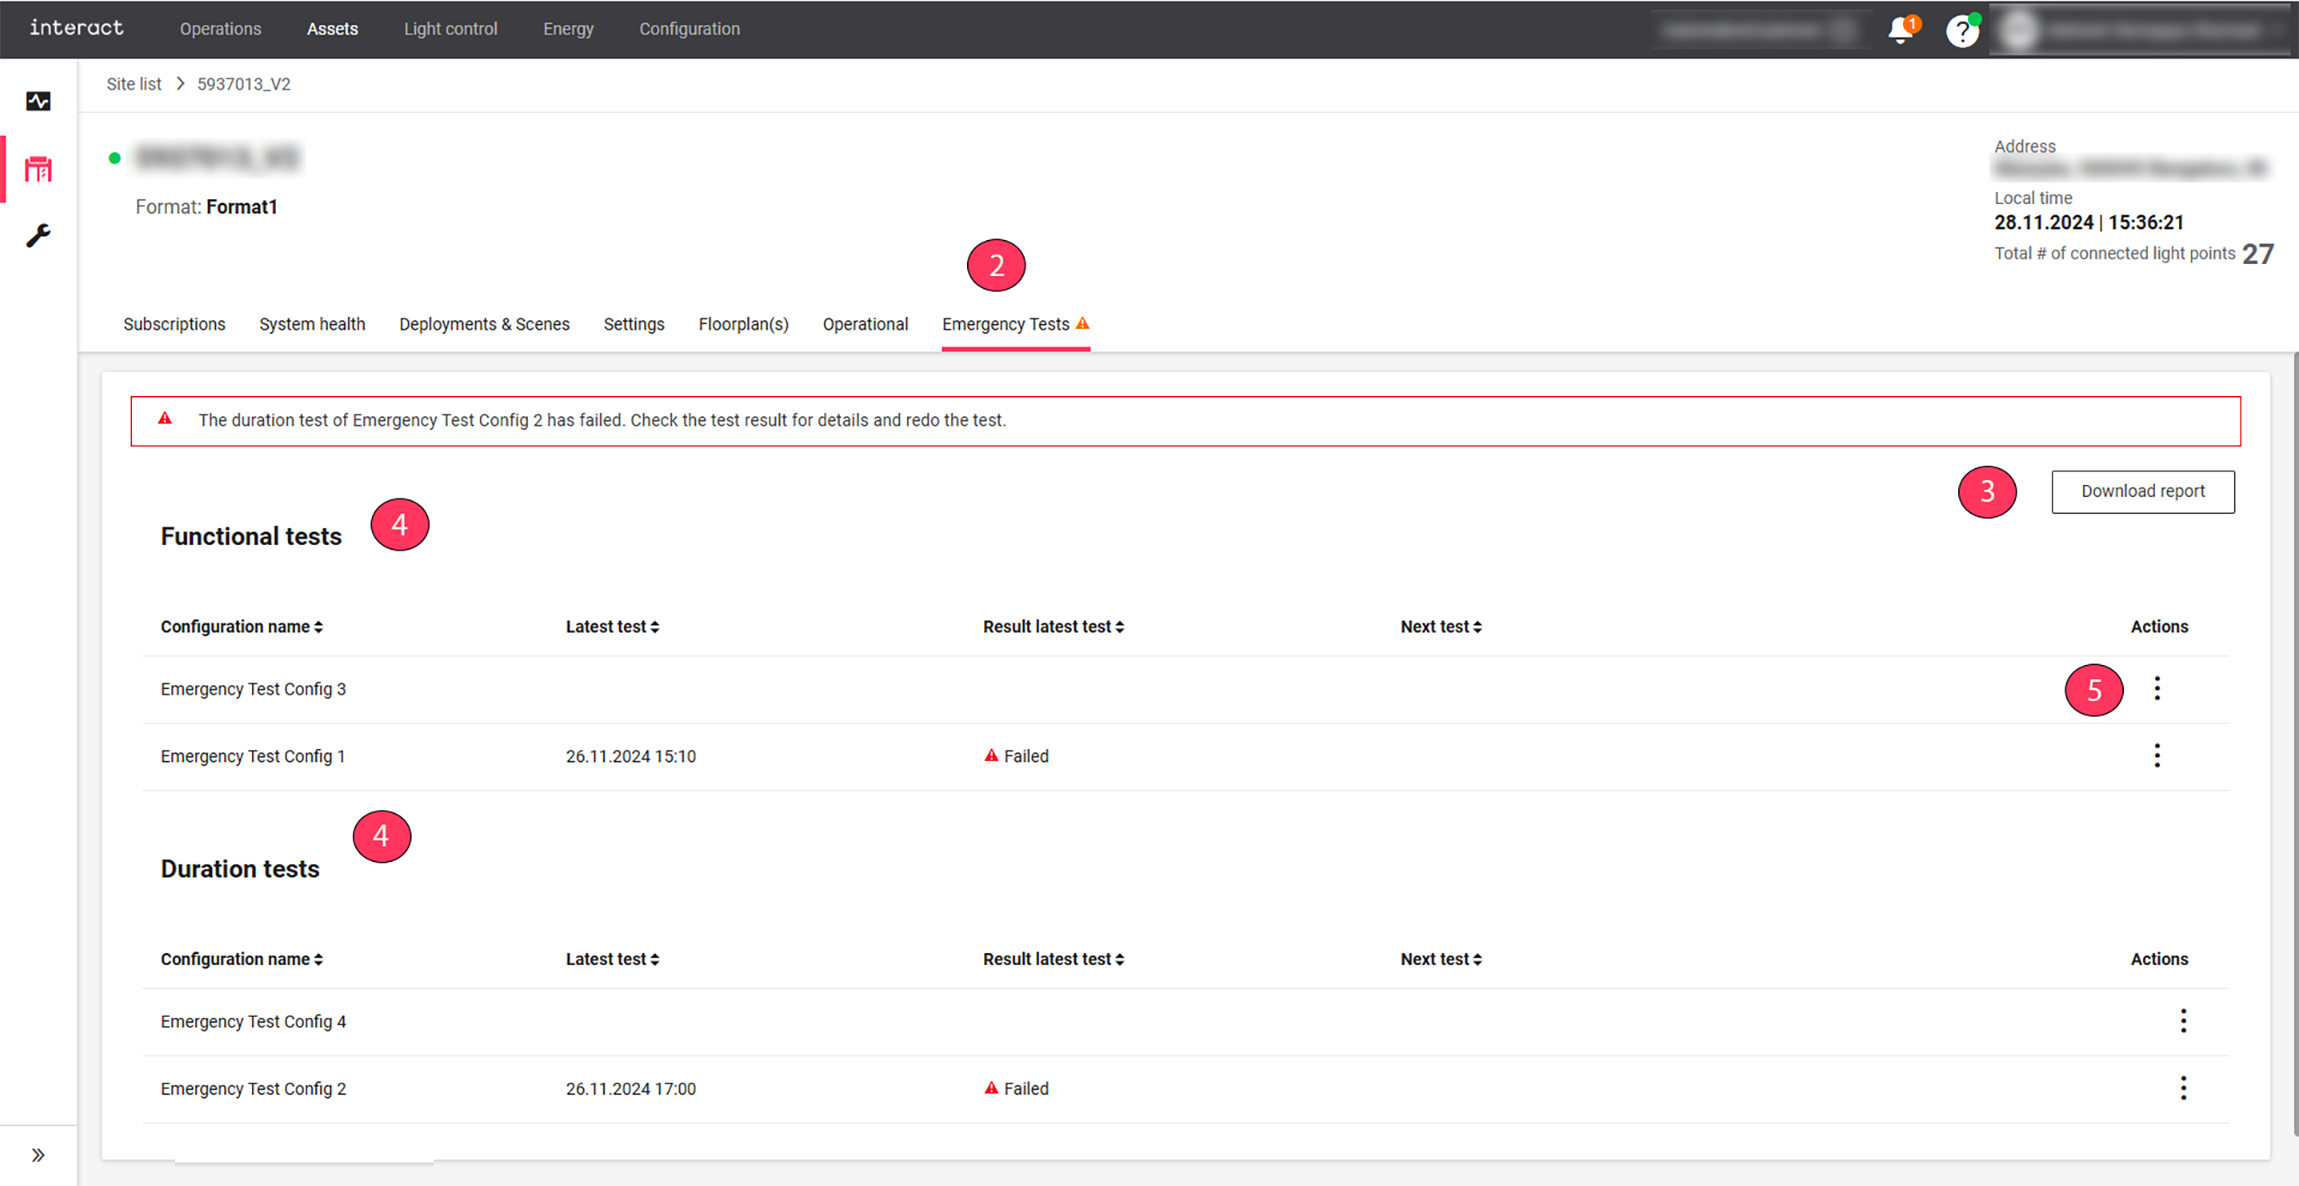
Emergency test
This section provides an instruction to access the detailed information of emergency tests.
-
In the Site list, click on a specific site to access the details of that site.
-
Click the Emergency Tests tab to view the details of functional tests and duration tests.
-
Click Download report button to download the emergency lighting test report of the selected site in PDF file format.
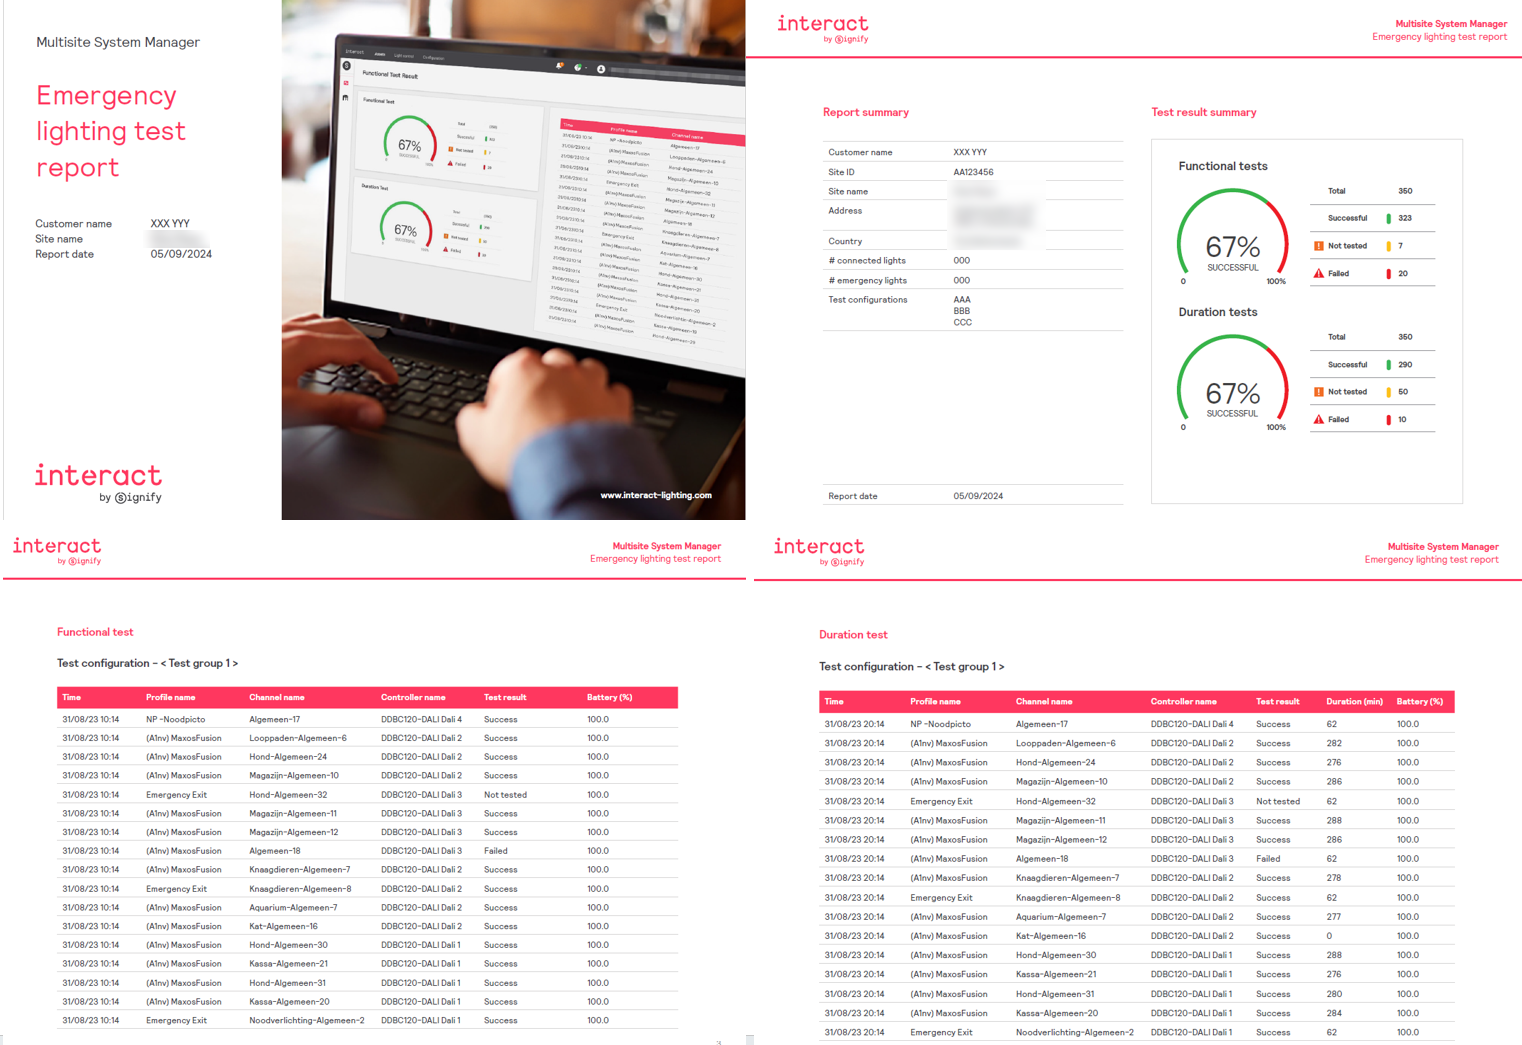 Sample screenshots of an emergency lighting test report
 -
Under Functional tests and Duration tests, you can find the latest test date and results of each test configuration.
-
To view more detailed information, navigate to Actions menu (
) → View details of each configurations.-
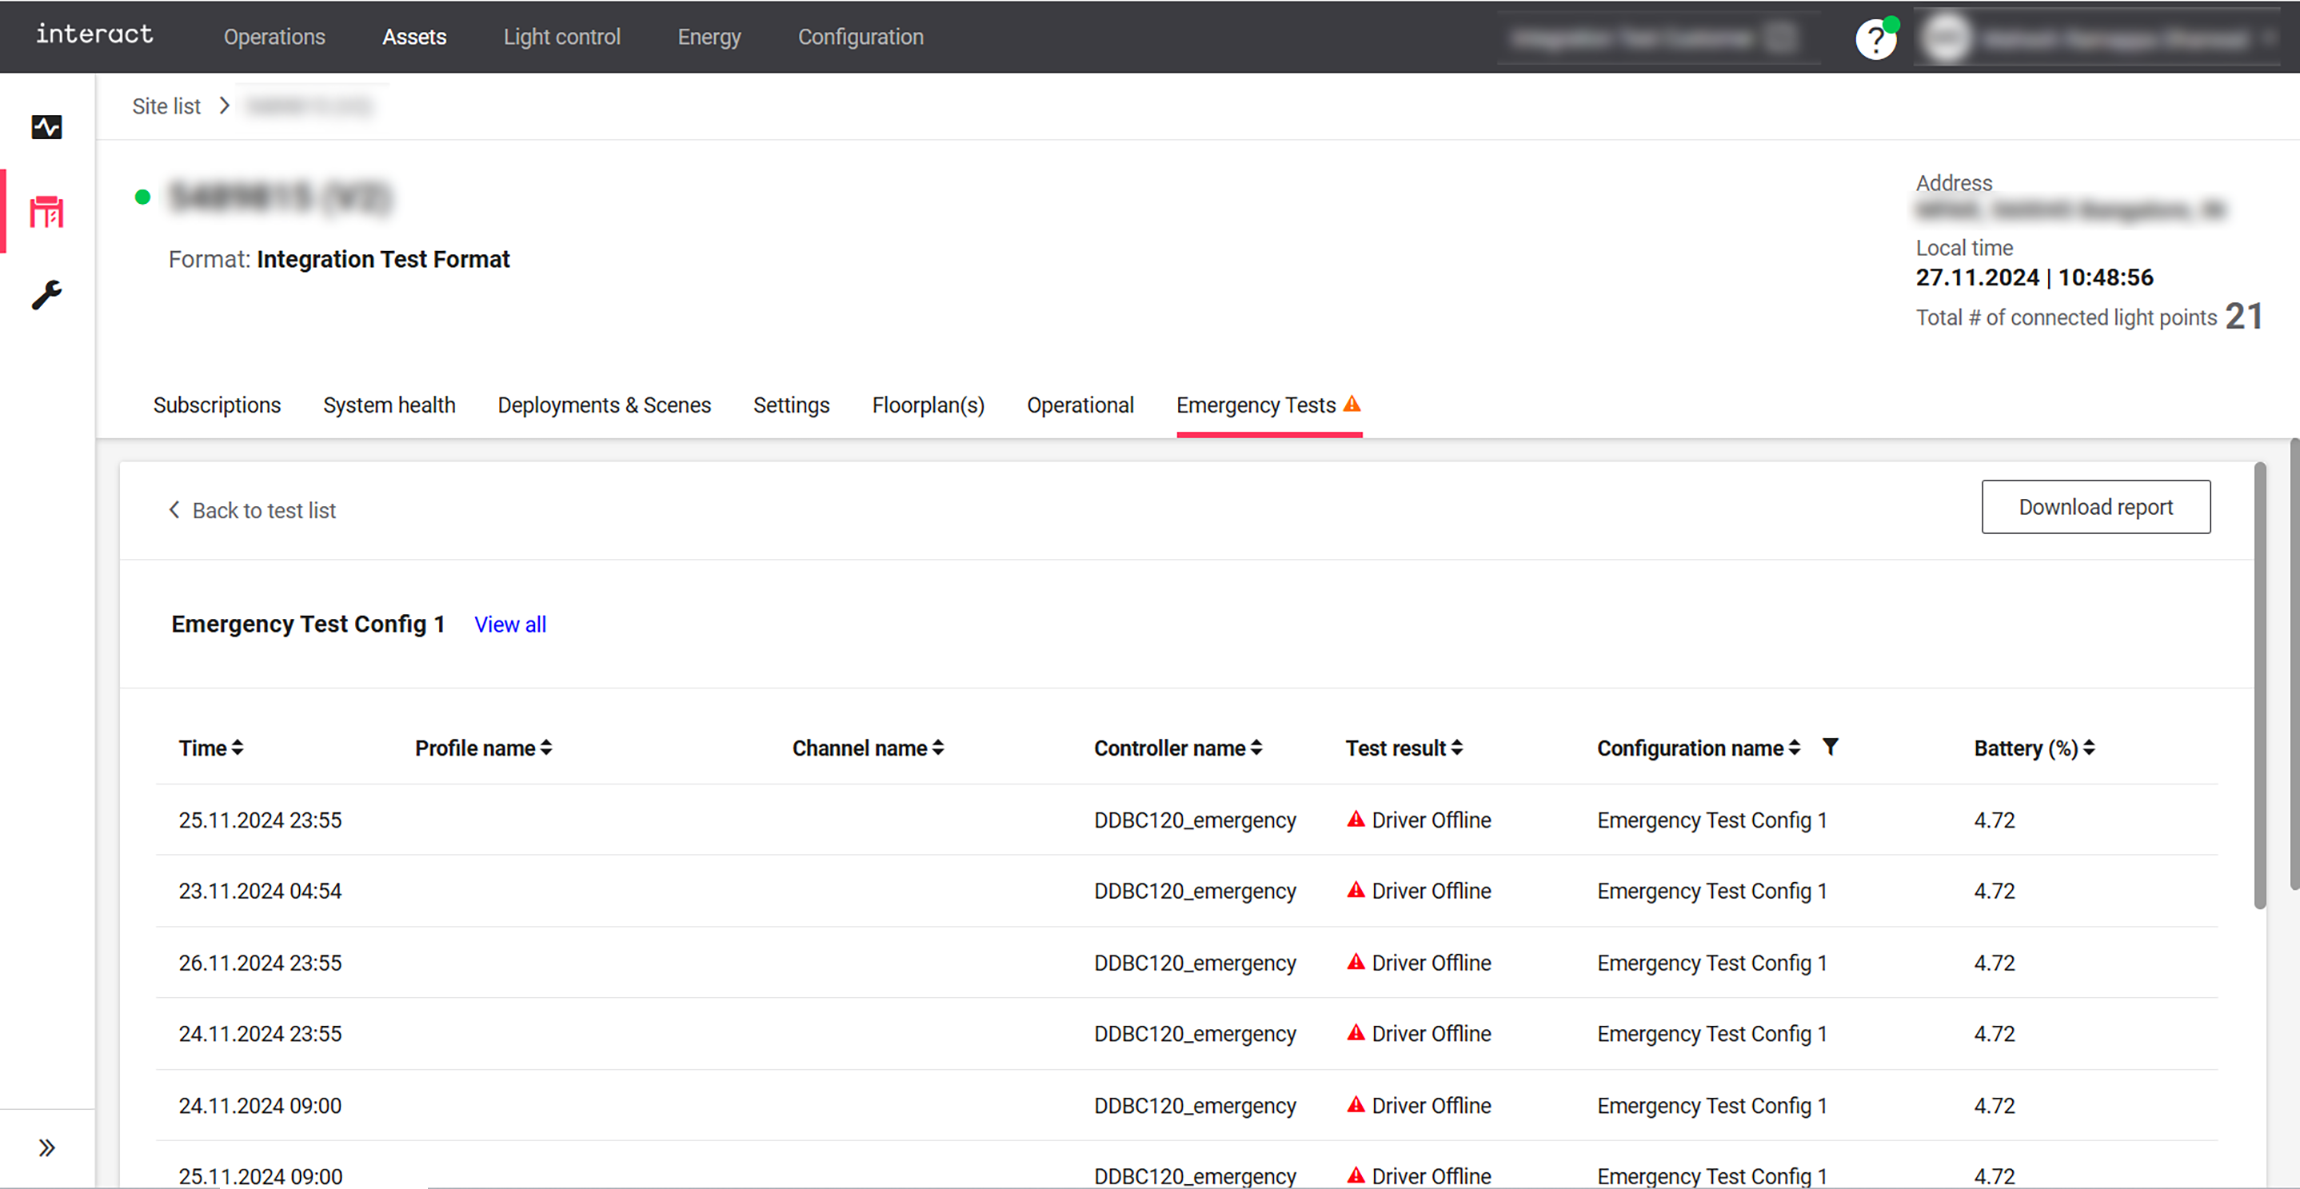
For functional tests, you can view the details like test date/time, profile name, channel name, controller name, test result, configuration name, and battery (%) for every emergency light fixture of the selected test configuration.
-
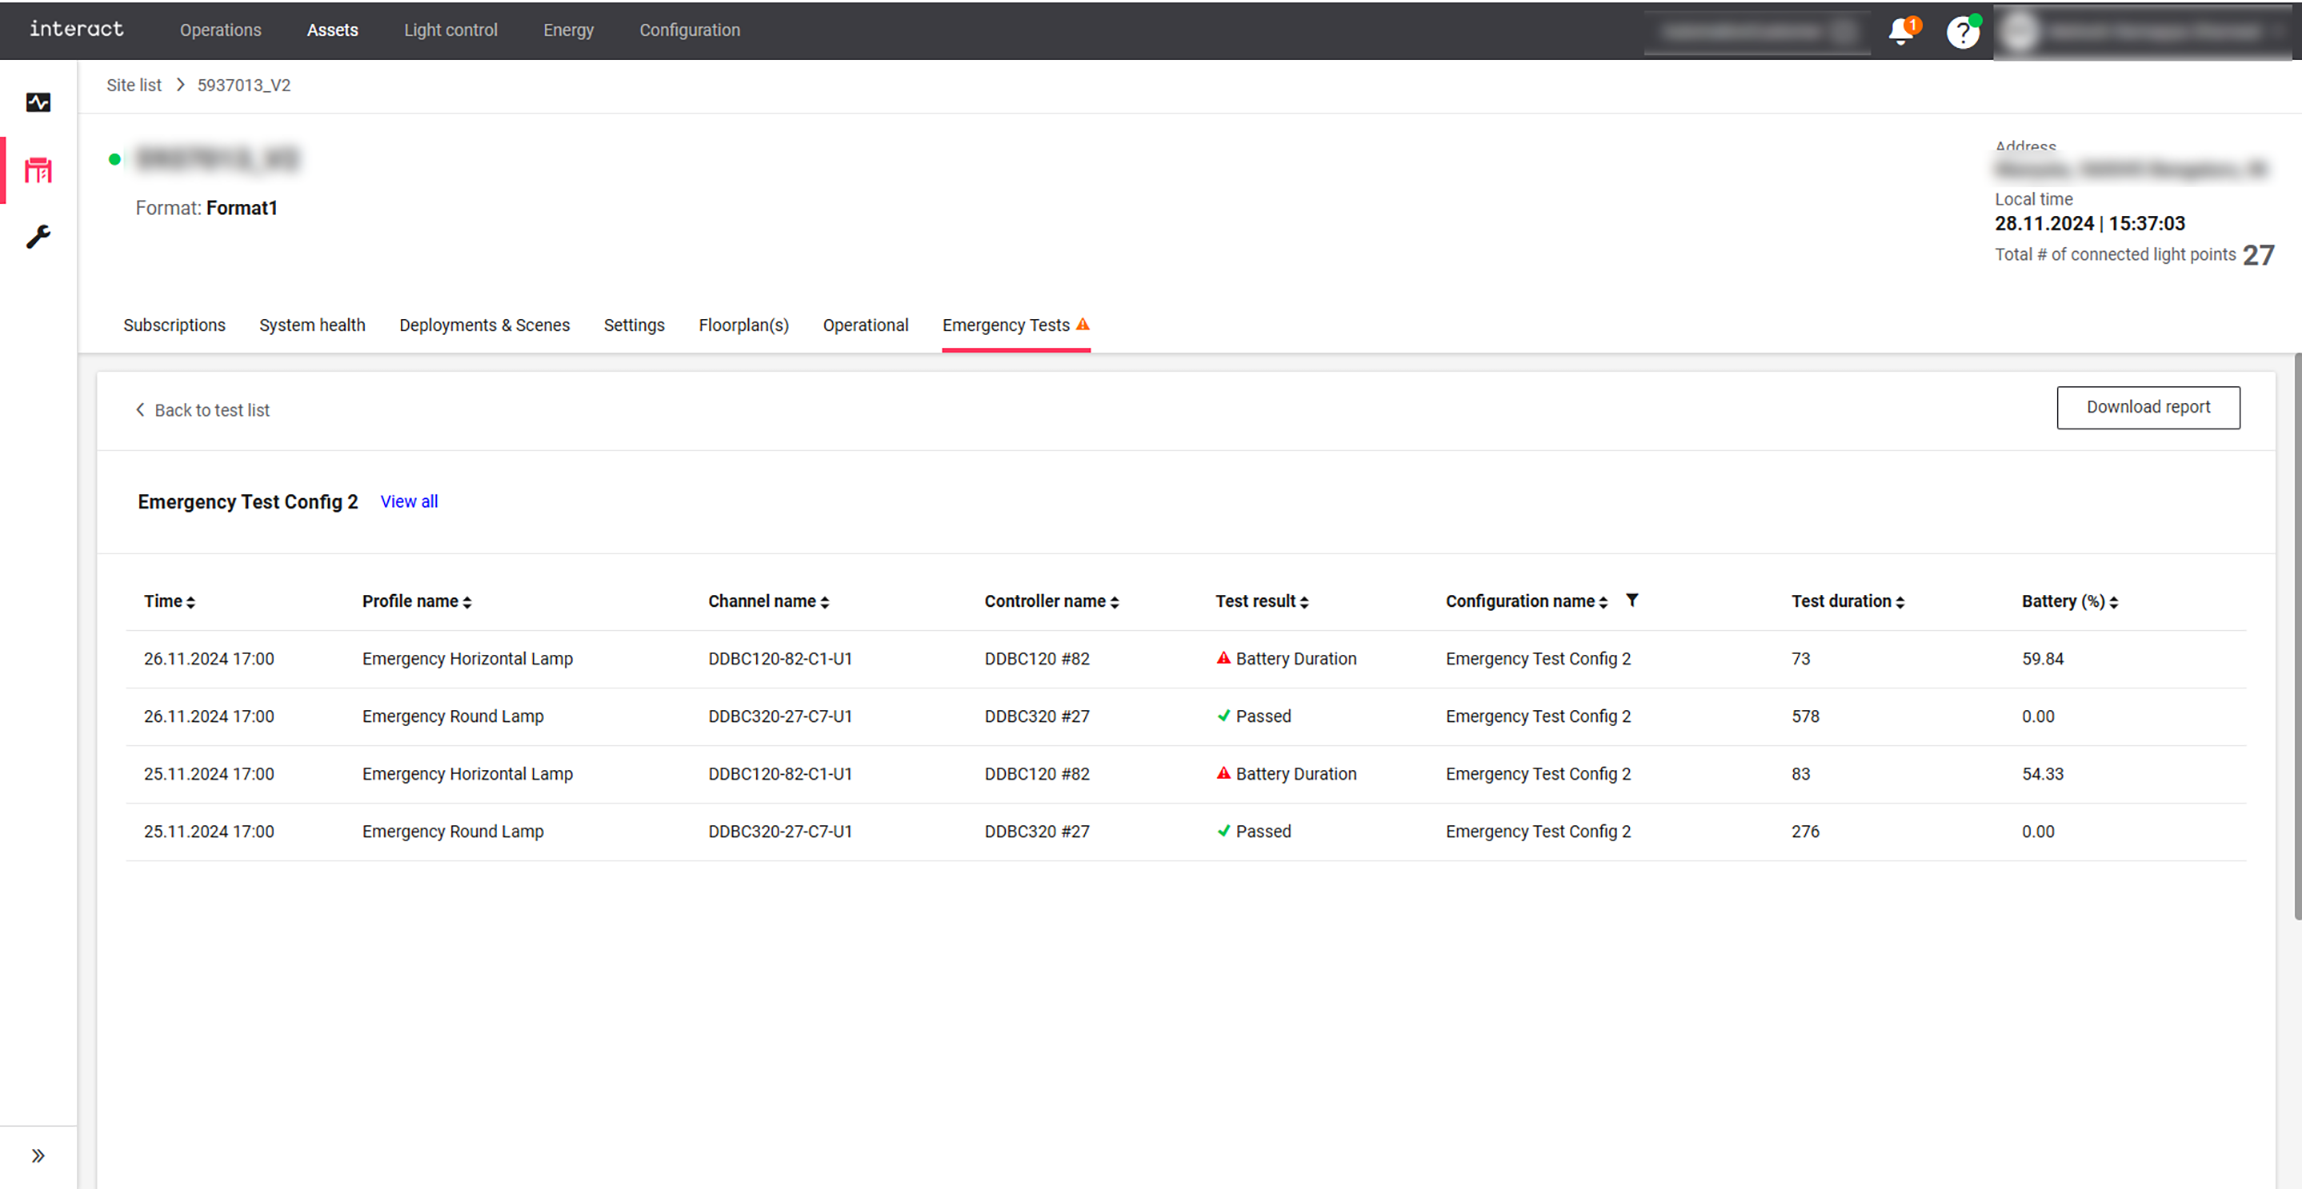
For duration tests, you can view the details like test date/time, profile name, channel name, controller name, test result, configuration name, test duration, and battery (%) for every emergency light fixture of the selected test configuration.
-
Explanation of possible test results:
| Result category | Symbol | Test results |
|---|---|---|
Successful |
|
The test is passed. |
In progress |
|
The test is running, pending or no test is scheduled. |
Failed |
|
The test is failed, lamp failure, circuit failure, battery failure, battery duration, battery is charging, network failure, driver offline, delay exceeded, in emergency mode, no emergency group, other test running, no timestamp, test timeout, unknown state or unknown reason. |